

November 30th marked the three-year anniversary since the public release of ChatGPT. Back then, the S&P 500 stood at 3,950 compared to its most recent close of 6,849 – a 73% increase and $24T gain in total market cap. Meanwhile, Nvidia’s most recent net income ($26.4B) has surpassed the combined sales of AMD (9.2B) and Intel ($13.7B). Defying the AI bubble worries, the earnings expectations for Mag7 continue to be revised upwards, while the remainder of the market has been revised downwards (relative to Apr 1, 2025; analysis by Apollo/Athene[1]). Meanwhile, the bond issuance by the big AI tech companies have surpassed $100B this year[2], with majority of the issuance coming from Oct/Nov. That is more than quadruple what was issued in the prior two years.
At the same time, the nominal US household net worth have increased by $31.4T (measured from 2022:Q4 to 2025:Q2) – an amount comparable to the total US federal debt (currently at $38.3T). Even when adjusted for inflation, the post-GPT rate of wealth creation was meaningfully higher compared to prior part of this century.
We highlighted the divide in components of the household wealth growth during this decade in the October credit conditions newsletter[3] from last year. One of the key aspects highlighted was that most of the gains since the beginning of pandemic came from the value of real estate net of mortgage debt and from direct investments, where vast majority of the gains were attributable to equities. That divide has further widened since the launch of ChatGPT. As it can be seen in Figure 1 (created using the Financial Accounts of the United States Z.1), the change in net worth have accelerated post ChatGPT launch. However, when equities are taken out of that figure, the growth has been quite modest or non-existent when other financial assets and real estate are removed. In other words, the spectacular wealth creation has benefitted primarily equity owners, while households not participating in equity and real estate markets have been left behind.
Further details on changes in asset component of net worth are present in Figure 2. As we have experienced significant inflation during the period covered, the values have been normalized to 2025:Q2 dollars. Looking further into the asset components, another troubling trend that has emerged: the decline in the value of proprietors’ equity in noncorporate business (or business ownership). This component of net worth has declined post-GPT by 10% in the inflation-adjusted terms. As it is the estimated dollar value of the ownership stakes that households and nonprofit organizations have in unincorporated businesses (like sole proprietorships and partnerships), it can be viewed as a proxy of the small business net worth. So, while the large AI companies have been thriving, the small businesses have been shrinking. Another notable observation is that the last time inflation-adjusted level of proprietor’s equity has declined was during the Global Financial Crisis (see Figure 3 displaying inflation-adjusted levels of assets going back to 1990).
Figure 1: Change in US Household Net Worth from 2019:Q4 ($T in 2025:Q2 Dollars)
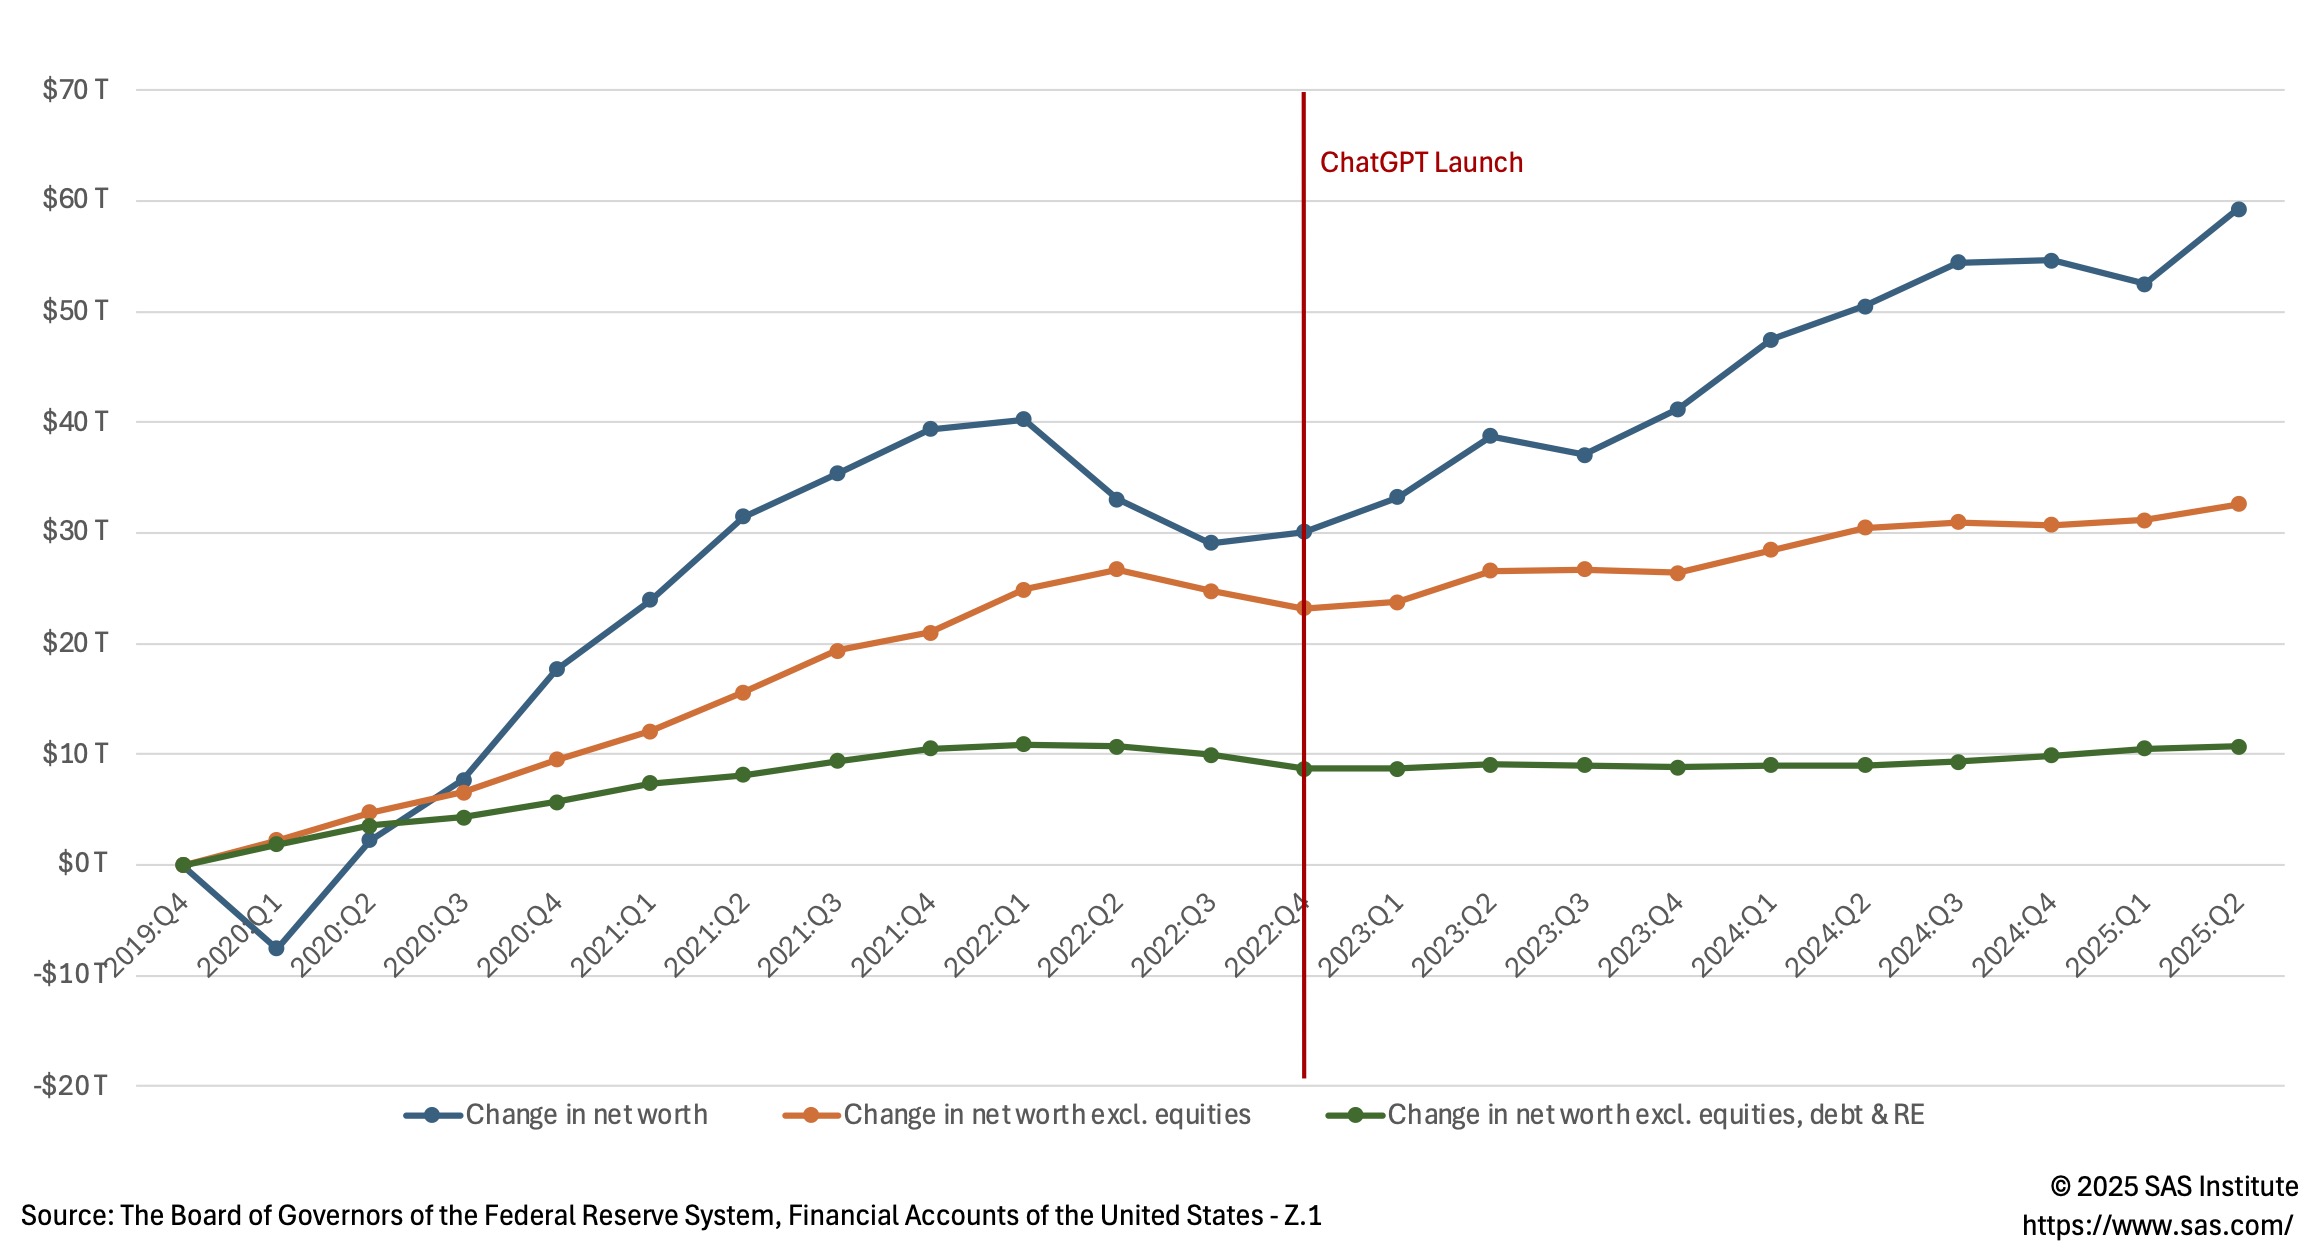
Figure 2: Change in Assets from 2019:Q4 ($T in Inflation-Adjusted 2025:Q2 Dollars)
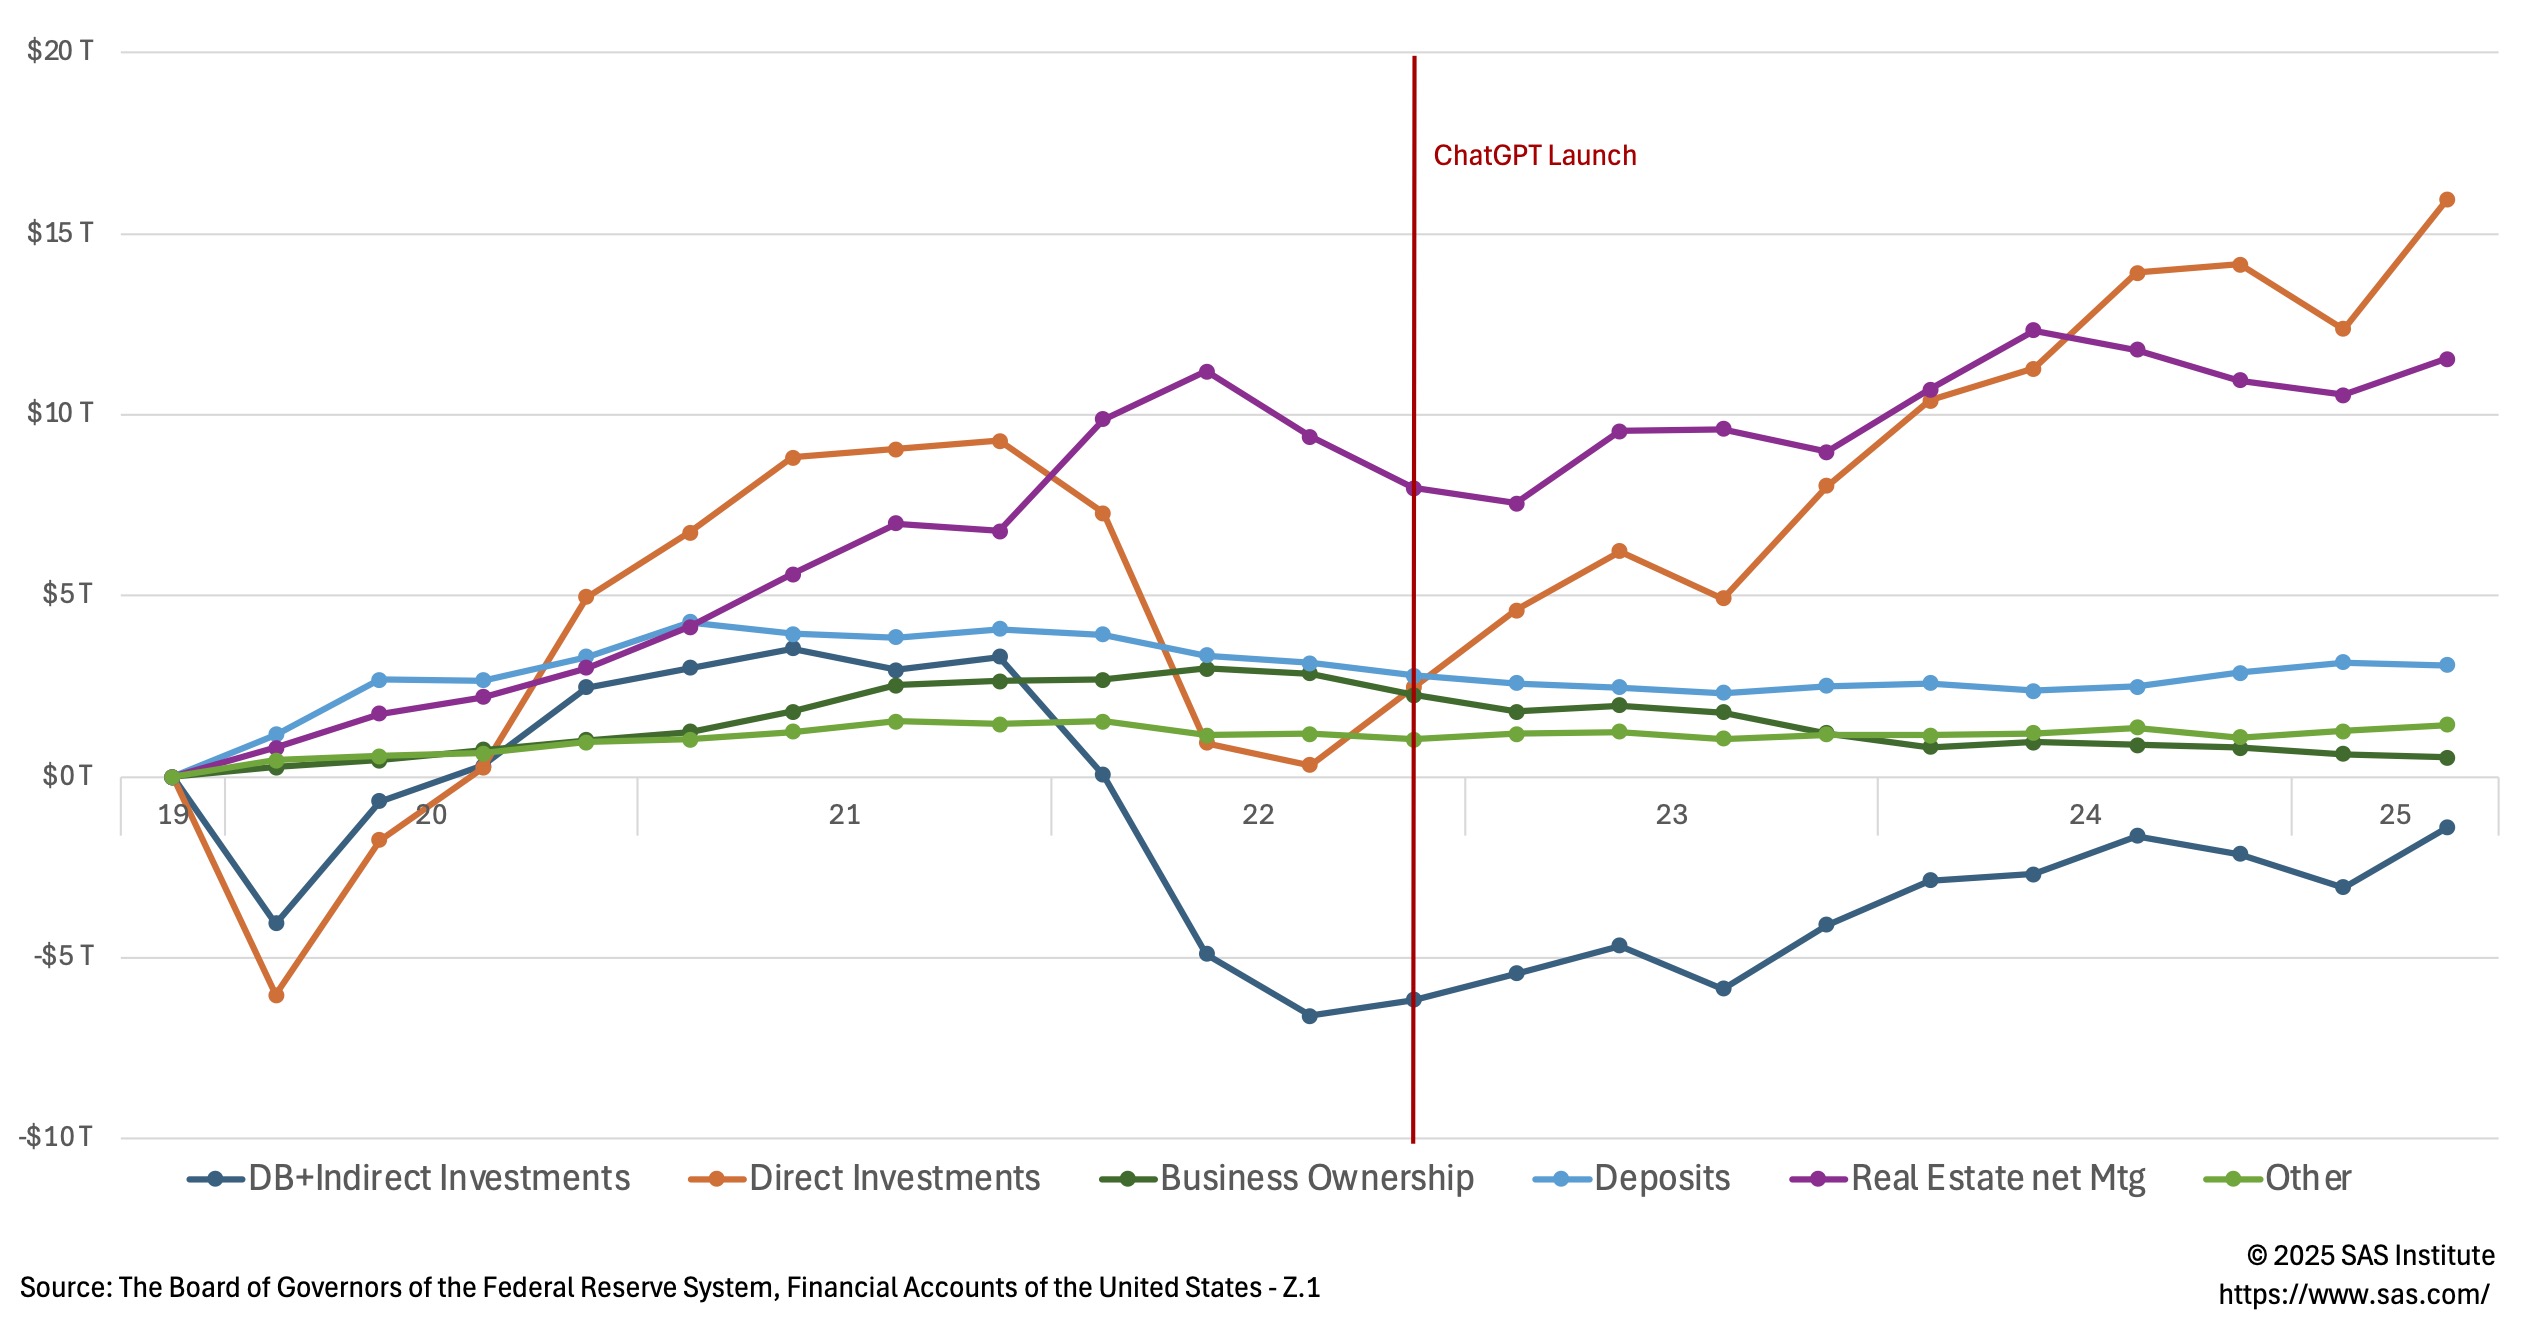
Figure 3: Total Assets Net of Mortgage Debt ($T in Inflation-Adjusted 2025:Q2 Dollars)
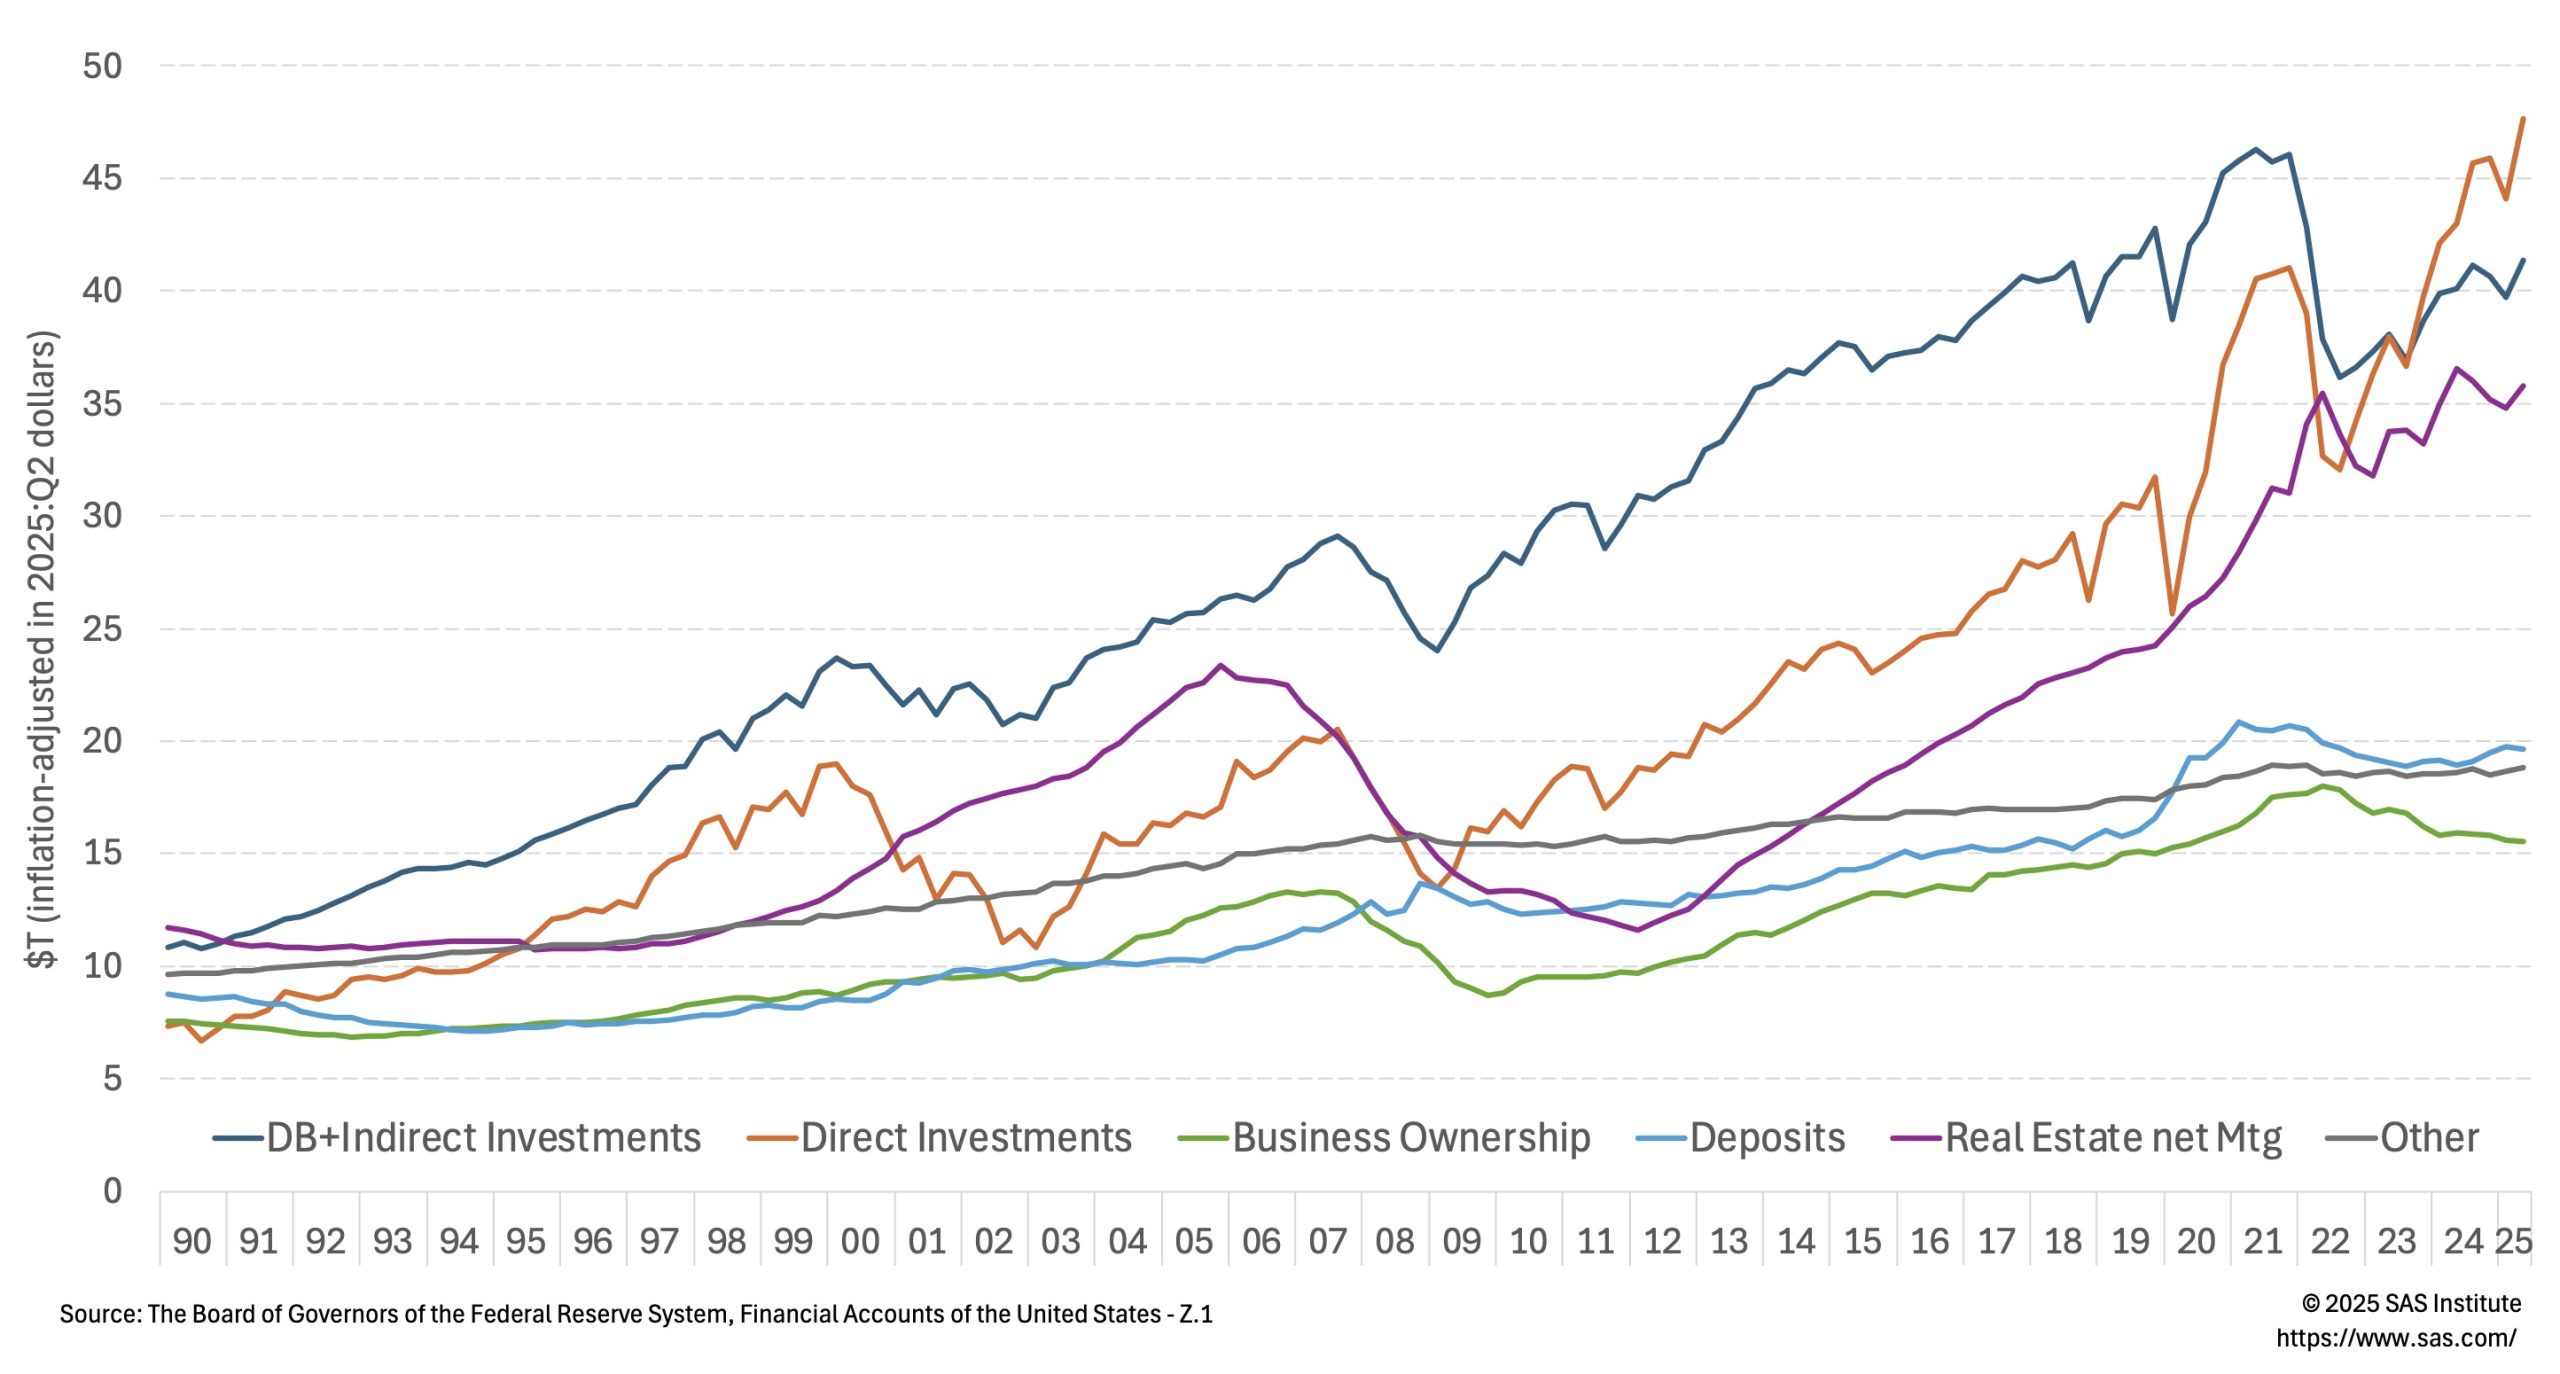
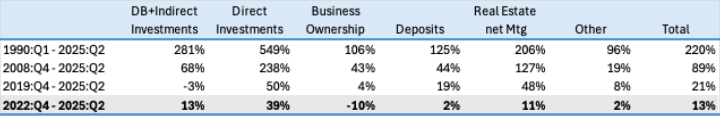
Table 1: Change in Real Value of Total Assets Net of Mortgage Debt
The bottom line is that behind the glowing headlines of the aggregate metrics, the bifurcation continues to accelerate in corporate as well as household segments of the economy. The AI-driven disruption has been a catalyst for the bifurcation both directly (e.g., ed-tech, marketing, consulting) as well as indirectly (via unequal impact on the household net worth). The gains from AI adoption have been highly uneven: concentrated among capital-rich firms and equity-owning households, while small businesses and lower-income consumers face tighter financing conditions and stagnating or declining wealth.
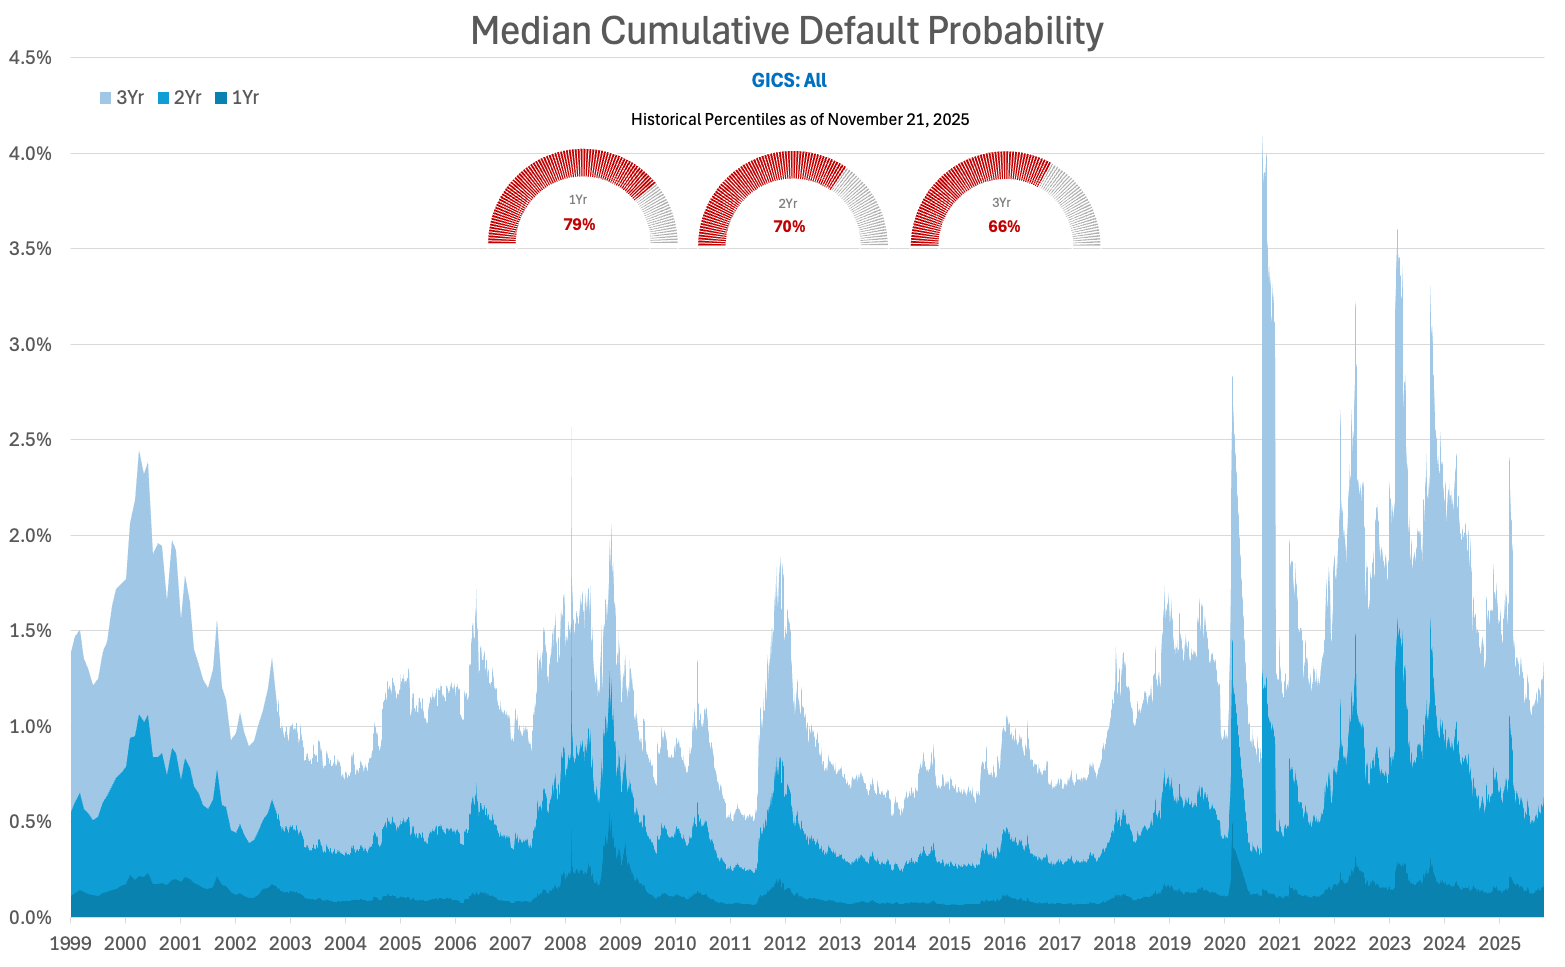
The uneven impact inevitably spills over into the realm of credit risk. Looking at KRIS[4] median cumulative default probability (non-cap weighted), the values continue to climb. The 1yr PD is now in the 79th percentile of its historical distribution (with 100th being the worst outlook). The smaller companies are clearly struggling, and the models are reflecting that stress.
Figure 4: Median Cumulative Default Probability – Top 3000 Companies in the United States
Sectors. Table 2 benchmarks each GICS sector against its long-run median using 1yr KDP measure. The Median column represents the median value of the daily median KDP going back to 1999. The columns that follow are historical snapshots of the median 1yr KDP and the last two columns are comparison of the most recent snapshot to historic median and its percentile.
Table 2: Median 1-year Default Probability (Top 3000 Firms in the United States)
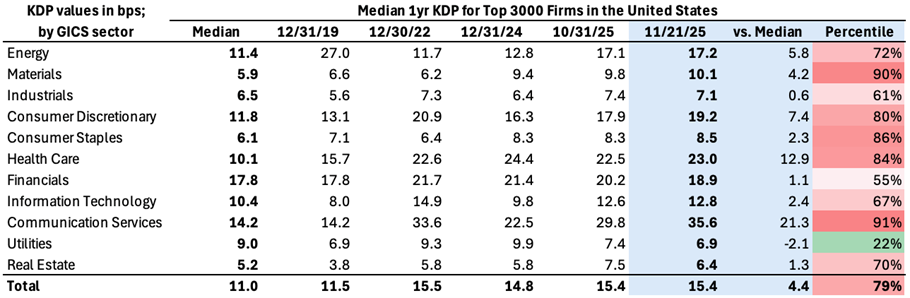
Most of the sectors are well above their historical medians. However, looking at medians tells only a part of the story. Figure 4 shows dispersion of the default probabilities by sector for 12/31/2019 and 11/21/2025 snapshots presented in box and whisker plot format. The whiskers of the diagram are at 5th and 95th percentiles. It is clear that the dispersion of the probabilities across sectors have increased. For example, consider the Consumer Discretionary sector – the typical cyclical bellwether. At the end of 2019, the median sector PD stood at 13bps. This November the same PD increased to 19bps. The 95th percentile for the sector, however, increased from 438bps to 671bps respectively.
Figure 5: 1yr Default Probability Distribution by Sector (5%/25%/75%/95%) – Top 3000 Companies in the United States
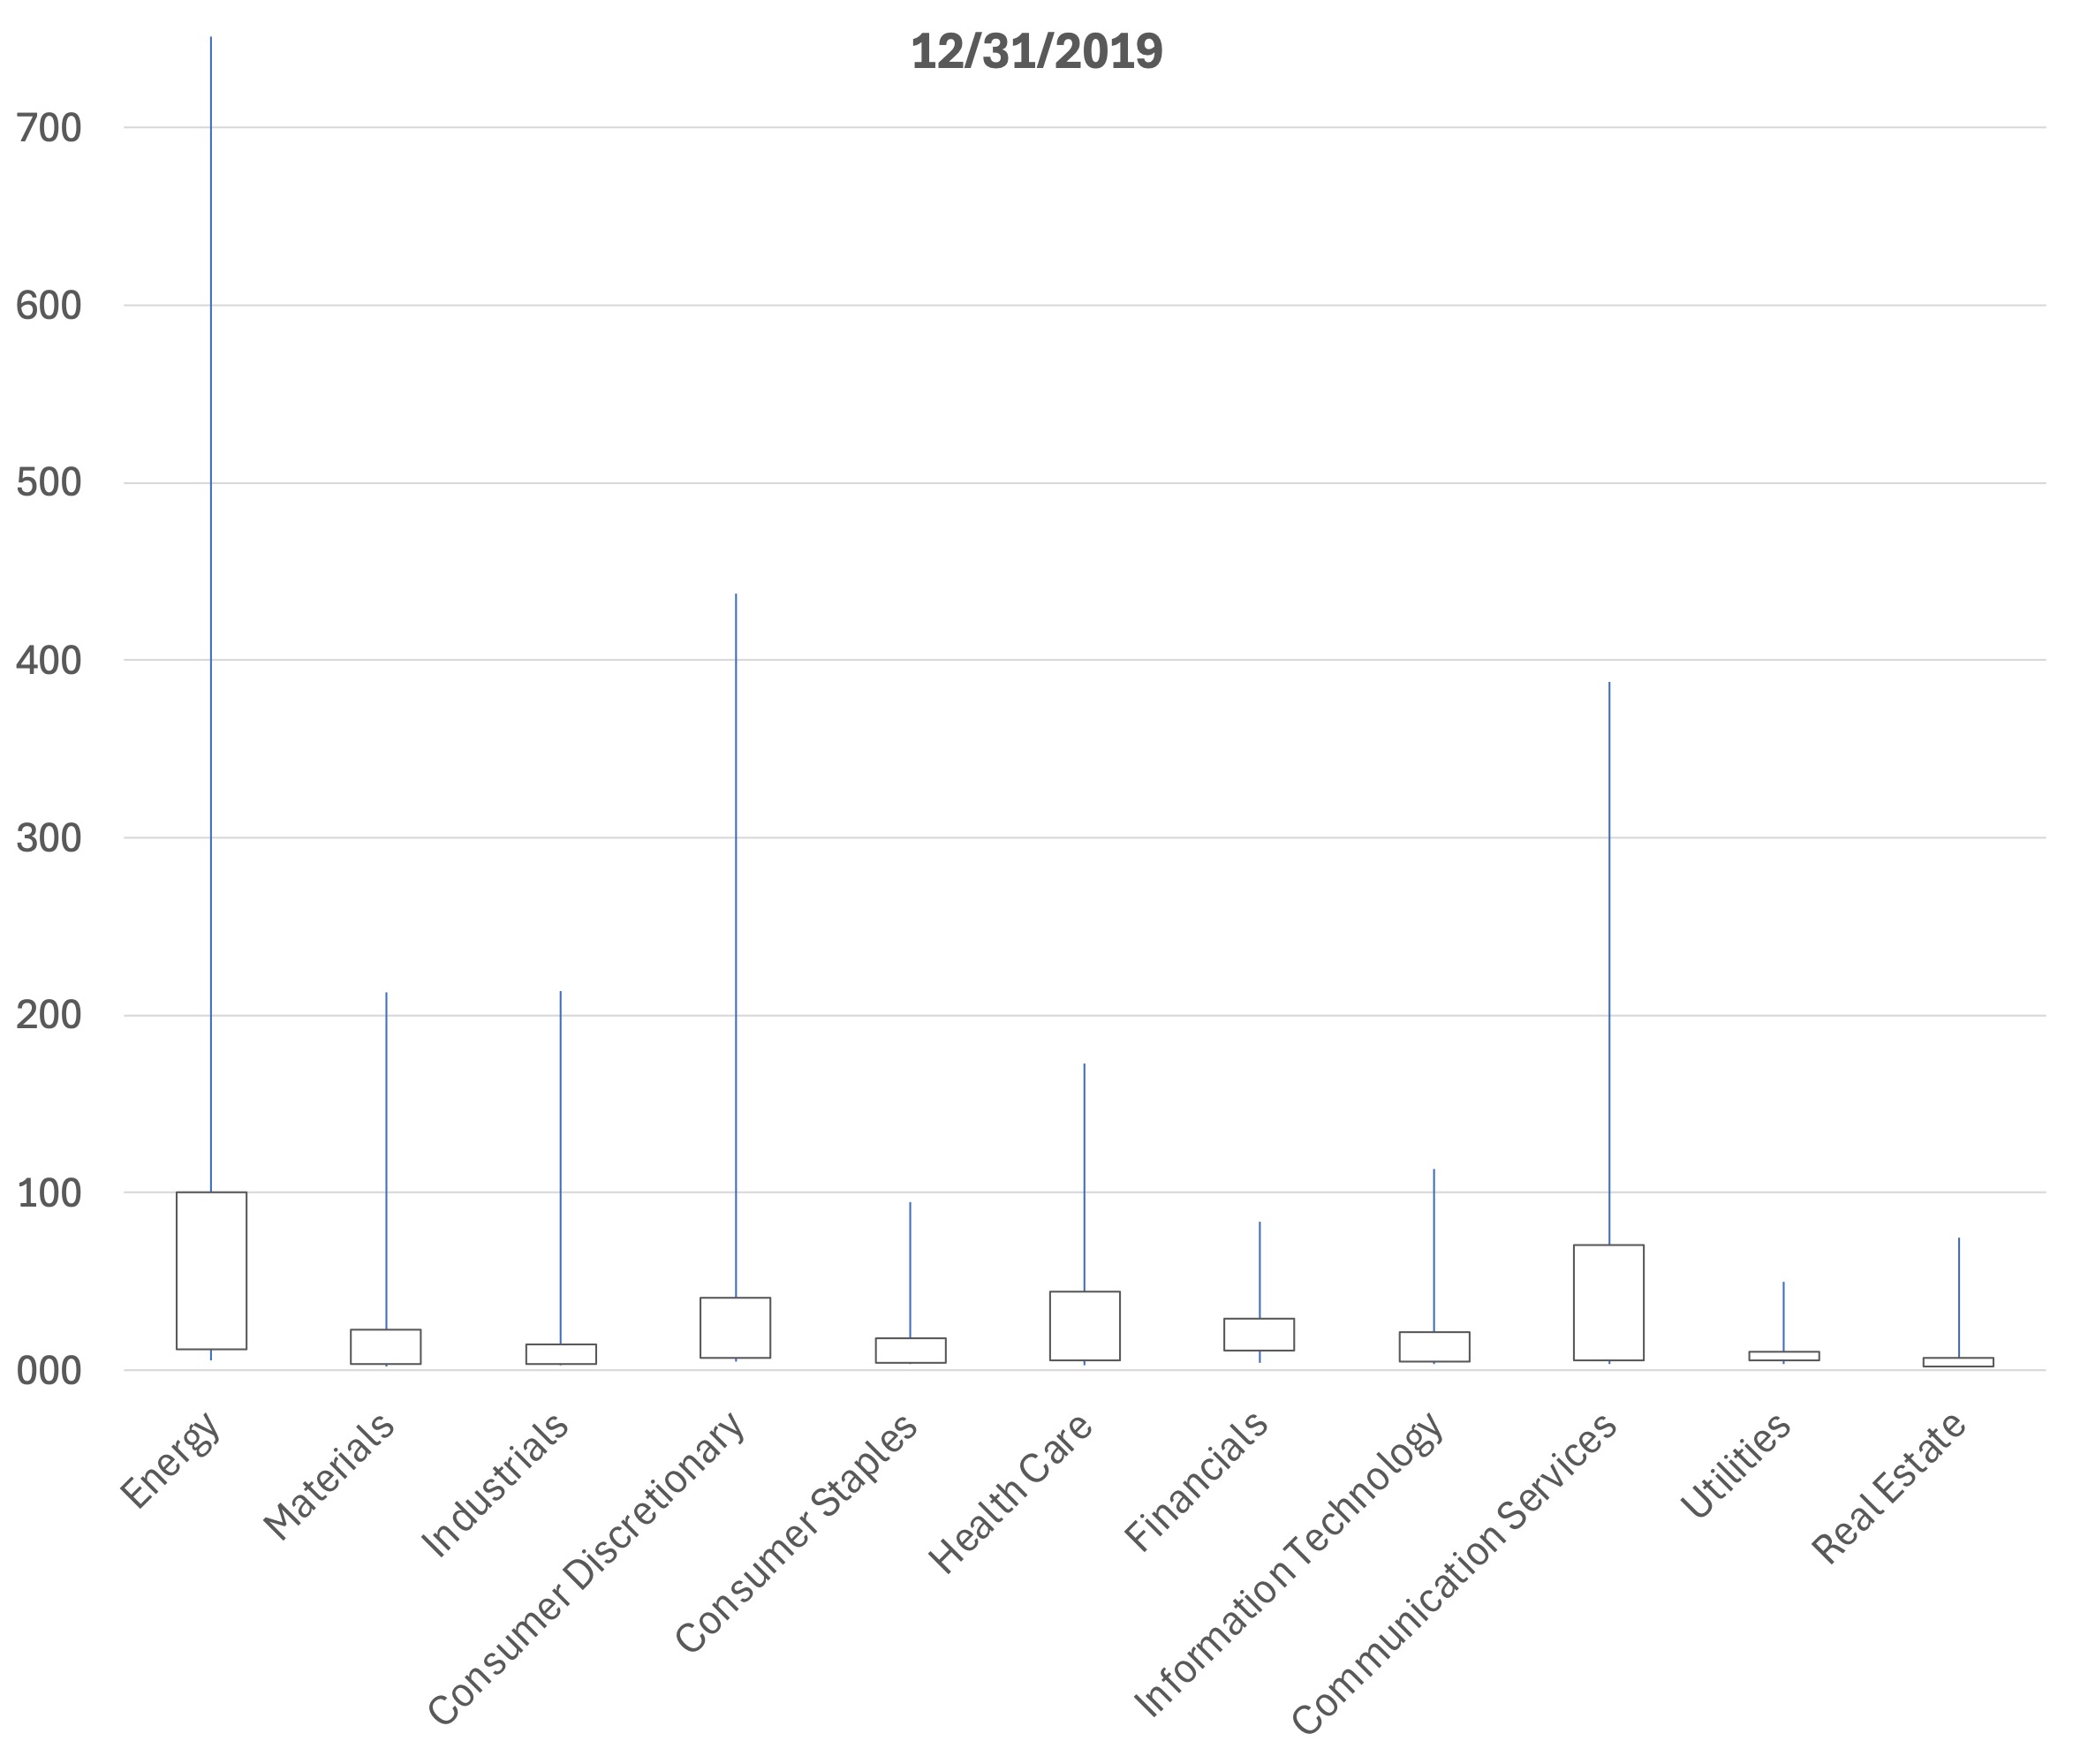
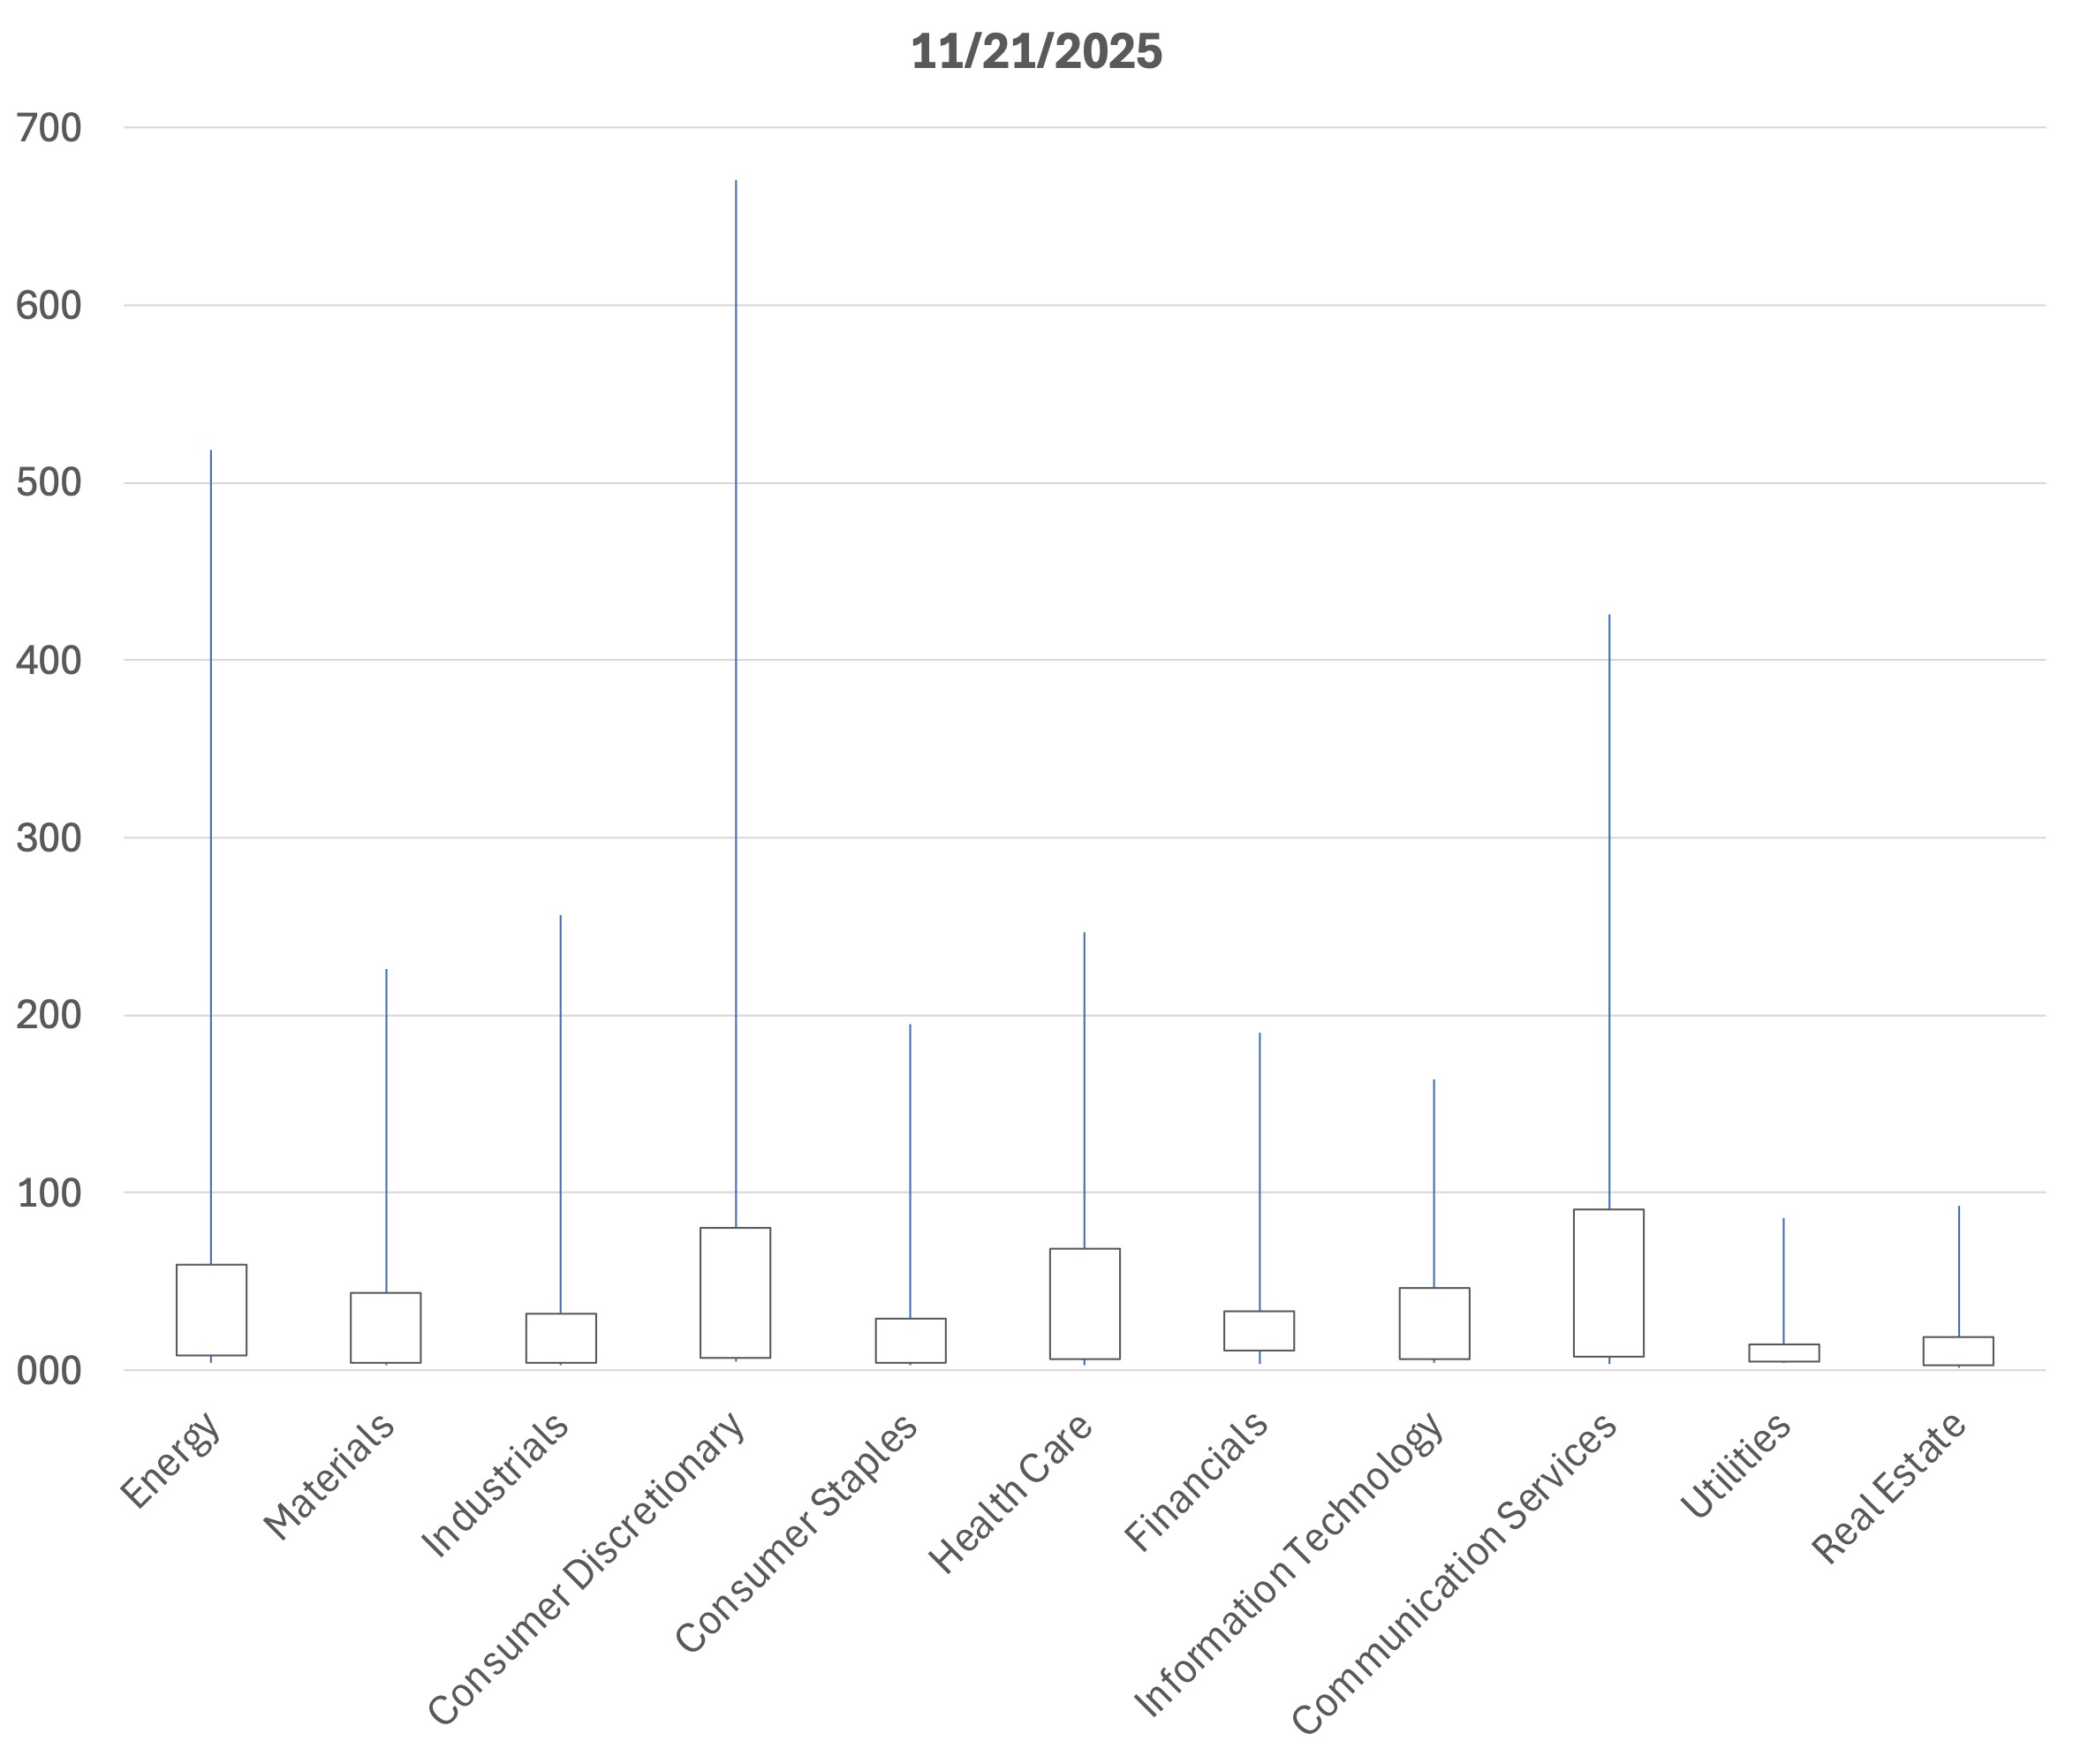
Table 3 displays the company-level details behind the tail of the Consumer Discretionary distribution.
Table 3: Consumer Discretionary – Top 10 Riskiest Companies (as of 11/21/25) – KDP in bps
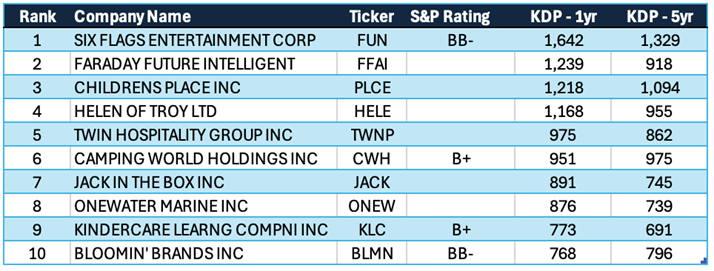
The common themes across the riskiest companies in the Consumer Discretionary are:
- Softening demand in lower-income sensitive categories (parks and out-of-home leisure, family apparel, childcare, casual dining, and big-ticket lifestyle goods).
- High operating leverage combined with high financial leverage
- Fragile or specialized funding structures (whole business securitizations, floorplan/inventory finance, etc.)
Taken together, this cohort is flashing an early warning: the combination of stretched low-income consumers and highly engineered balance sheets is showing up as an elevated near-term default risk, even though index-level spreads continue to look benign.
Three years after the launch of ChatGPT, the U.S. economy has delivered extraordinary top-line gains. However, those gains have been distributed in a profoundly uneven way. The same dynamic is now embedded in the credit markets: headline spreads remain well-behaved even as the long tail of small, lower-margin, and higher-leverage firms shows rising stress. In this environment, dispersion defines risk. KRIS default probabilities make that dispersion visible. As we enter 2026, that visibility is essential: the next phase of the cycle will be shaped not by broad weakness, but by the widening gap between firms positioned to harness the AI era and those struggling to adapt to it.
Why KRIS KDP matters now. Market prices can remain calm even as underlying risk concentrates, making model-based, issuer-level signals essential. KRIS default probabilities provide daily, issuer-level signals that make the bifurcation visible – pinpointing names where refinancing pressure, equity-vol shocks, or weakening coverage are rising even when spreads don’t budge. Used alongside market spreads and fundamentals, KDPs help identify issues not yet priced, providing actionable early warnings.
Contemporaneous Credit Conditions
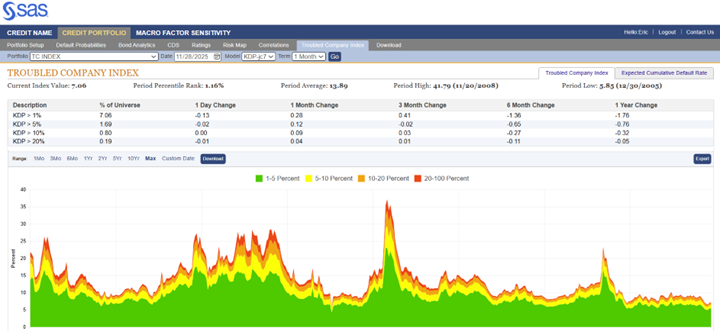
The Kamakura Troubled Company Index® closed the month of November at 7.06%, down 0.05% from the prior month. The index measures the percentage of 42,512 public firms worldwide with an annualized one-month default probability of over 1%. An increase in the index reflects declining credit quality, while a decrease reflects improving credit quality.
At the end of November, the percentage of companies with a default probability between 1% and 5% was 5.37%. The percentage with a default probability between 5% and 10% was 0.89%. Those with a default probability between 10% and 20% amounted to 0.61% of the total; and those with a default probability of over 20% amounted to 0.19%. For the month, the percentage of companies with a short-term default probability over 1% ranged from a low of 7.06% on November 28th to a high of 7.85% on November 20th.
Figure 6: Troubled Company Index®, November 28th, 2025
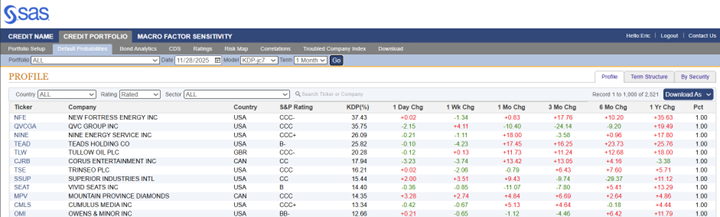
At the end of November, the riskiest 1% of rated public firms within the coverage universe as measured by 1-month default probability included nine companies in the U.S. , one in Canada and two in the UK. NEW FORTRESS ENERGY INC (NASDAQ:NFE) is the riskiest rated firm in our universe, with a 1-month KDP of 37.43%–up 0.83% over the past month.
Table 4: Riskiest Rated Companies Based on 1-month KDP, November 28th, 2025
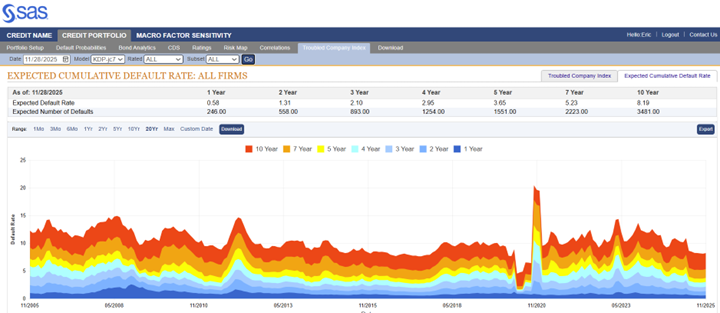
The Expected Cumulative Default Rate, the only daily index of credit quality of rated firms worldwide, shows the one-year rate of 0.58% up 0.11% from the prior month, with the 10-year rate up 1.13% at 8.19%.
Figure 7: Expected Cumulative Default Rates, October 31, 2025
About the Troubled Company Index
The Kamakura Troubled Company Index® measures the percentage of 42,500 public firms in 76 countries that have an annualized one-month default risk of over one percent. The average index value since January 1990 is 13.94%. Since July 2022, the index has used the annualized one-month default probability produced by the KRIS version 7.0 Jarrow-Chava reduced form default probability model, a formula that bases default predictions on a sophisticated combination of financial ratios, stock price history, and macro-economic factors.
The KRIS version 7.0 models were developed using a data base of more than 4 million observations and more than 4,000 corporate failures. A complete technical guide, including full model test results and key parameters, is provided to subscribers. Available models include the non-public-firm default model, the U.S. bank model, and the sovereign model.
The version 7.0 model was estimated over the period from 1990, through the Great Recession and ending in February 2022. The 76 countries currently covered by the index are Argentina, Australia, Austria, Bahrain, Bangladesh, Belgium, Belize, Botswana, Brazil, Bulgaria, Canada, Chile, China, Colombia, Croatia, Cyprus, Czech Republic, Denmark, Egypt, Estonia, Finland, France, Germany, Ghana, Greece, Hungary, Hong Kong, Iceland, India, Indonesia, Ireland, Israel, Italy, Japan, Jordan, Kenya, Kuwait, Luxembourg, Malaysia, Malta, Mauritius, Mexico, Nigeria, the Netherlands, New Zealand, Norway, Oman, Pakistan, Peru, the Philippines, Poland, Portugal, Qatar, Romania, Russia, Saudi Arabia, Serbia, Singapore, Slovakia, Slovenia, South Africa, South Korea, Spain, Sri Lanka, Sweden, Switzerland, Tanzania, Taiwan, Thailand, Turkey, the United Arab Emirates, Uganda, the UK, the U.S., Vietnam and Zimbabwe.
About SAS
SAS is the leader in analytics. Through innovative software and services, SAS empowers and inspires customers around the world to transform data into intelligence. SAS gives you THE POWER TO KNOW®.
Editorial contacts:
- Stas Melnikov – Stas.Melnikov@sas.com
- Eric Penanhoat – Eric.Penanhoat@sas.com
[1] https://www.apolloacademy.com/wp-content/uploads/2025/11/110525-Charts.pdf
[2] https://www.wsj.com/finance/investing/wall-street-ai-spending-bubble-810d270e