

Research
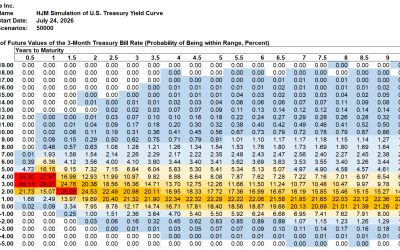
SAS Weekly Treasury Simulation, July 24, 2026: 53% Probability of 3-Month Bill Yield Over 4% in One Year
Summary The most likely range for 3-month bill yields in 10 years remained at the 1% to 2% range this week. The probability of...
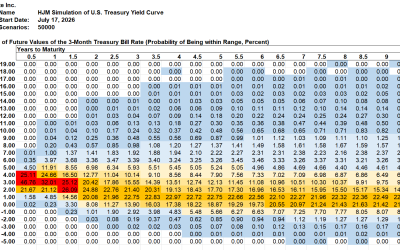
SAS Weekly Treasury Simulation, July 17, 2026: 42% Probability of 3-Month Bill Yield Over 4% in One Year
Summary The most likely range for 3-month bill yields in 10 years remained at the 1% to 2% range this week. The probability of...
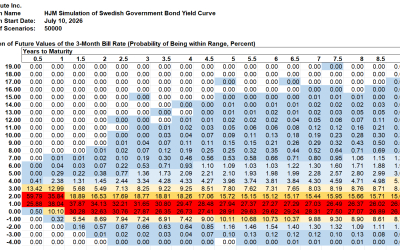
HJM++© Correlated Government Yield and Foreign Exchange Rate Simulations for Asia-Pacific, Europe and North America, July 10, 2026
The Heath, Jarrow and Morton [1992] framework for simulation and valuation using risk-free interest rates has been called “the...
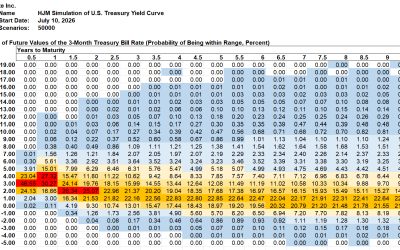
SAS Weekly Treasury Simulation, July 10, 2026: 50% Probability of 3-Month Bill Yields Over 4% in Early 2027
Summary The most likely range for 3-month bill yields in 10 years remained at the 1% to 2% range this week. The probability of...
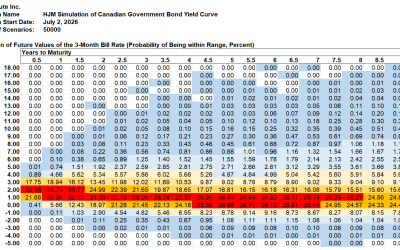
HJM++© Correlated Government Yield and Foreign Exchange Rate Simulations for Asia-Pacific, Europe and North America, July 2, 2026
The Heath, Jarrow and Morton [1992] framework for simulation and valuation using risk-free interest rates has been called “the...

SAS Weekly Treasury Simulation, July 2, 2026: Probability of Higher 3-Month T-bill Rates Jumps in First Half of 2027
Summary The most likely range for 3-month bill yields in 10 years remained at the 1% to 2% range this week. The probability of...
The SaaSpocalypse Impact on Credit
For much of 2026, one question has dominated the technology sector: what happens to traditional software companies when...
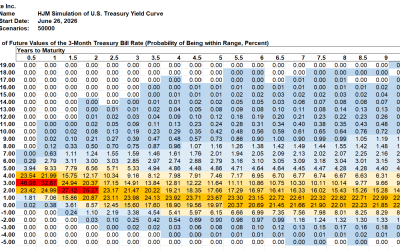
HJM++© Correlated Government Yield and Foreign Exchange Rate Simulations for Asia-Pacific, Europe and North America, June 26, 2026
The Heath, Jarrow and Morton [1992] framework for simulation and valuation using risk-free interest rates has been called “the...
SAS Weekly Treasury Simulation, June 26, 2026: Probability of Inverted Yields by March 2027 Remains Over 20%
Summary The most likely range for 3-month bill yields in 10 years remained at the 1% to 2% range this week. The probability of...
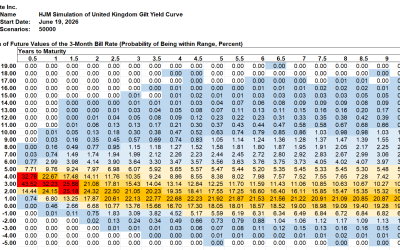
HJM++© Correlated Government Yield and Foreign Exchange Rate Simulations for Asia-Pacific, Europe and North America, June 19, 2026
The Heath, Jarrow and Morton [1992] framework for simulation and valuation using risk-free interest rates has been called “the...
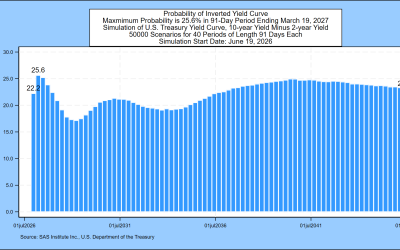
SAS Weekly Treasury Simulation, June 19, 2026: 25% Probability of Inverted Yields by March 2027
Summary The most likely range for 3-month bill yields in 10 years remained at the 1% to 2% range this week. The probability of...
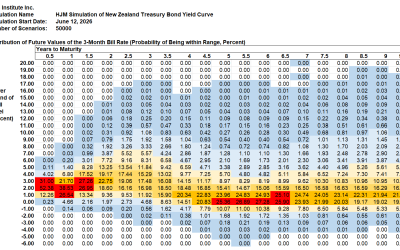
HJM++© Correlated Government Yield and Foreign Exchange Rate Simulations for Asia-Pacific, Europe and North America, June 12, 2026
The Heath, Jarrow and Morton [1992] framework for simulation and valuation using risk-free interest rates has been called “the...