What the Markets got Wrong in 2022
Will They Get It Right in 2023?
Kamakura Troubled Company Index Decreases by 0.19% to 8.01%
Credit Quality Improves Slightly to the 98th Percentile
NEW YORK, January 3, 2023: In December, the markets experienced one of the worst sell-offs in both bonds and stocks since the 1970s. Why? It’s important to remember that while markets discount the future, they also adjust for mistakes of the past. During 2022, there were a lot of corrections for assumptions the markets got wrong. At the top of the list was the failure to anticipate the impact of inflation, closely followed by the failure to anticipate that the Federal Reserve would react decisively. As the year drew to a close, who could have predicted that the U.S. Congress would pass a massive spending bill, much less how it would impact the fight against inflation? And what will be the impact of higher rates on the equally massive level of U.S. debt?
The markets have misjudged both China and Russia throughout the year, and the actions that can be expected from them in 2023 remain a mystery. The meltdown that shook the crypto world was no surprise to the markets, given their muted reaction. But it does raise questions about whether there are legitimate (think economic) uses for crypto. The good news is that we will likely be spared crypto ads during the 2023 Superbowl.
The past year’s events also raise other topics to muse over. Does the takeover of Twitter by Elon Musk represent the beginning or the end of free speech in social media? How will the decision of natural resources companies not to invest in capacity affect the ongoing shortages in so many commodities?
Workplace and consumer habits raise further questions. As Covid ends, will we see employees return to work or continue to work from home? What are the economic implications for local businesses, particularly at a time when employers and economists continue to scratch their heads about where all the workers have gone? The consumer has continued to be the driver of the economy, even as personal savings rates have crashed back down to earth, a possible sign of slowing inflation. From a credit risk management standpoint, this poses questions about consumer delinquencies and defaults as interest rates rise and home prices and used car prices normalize.
In a word, the outlook for 2023 is pessimistic. And that may be a good sign not only for contrarians, but for those who are shrewd enough to closely examine the reset that is occurring in factor correlations.
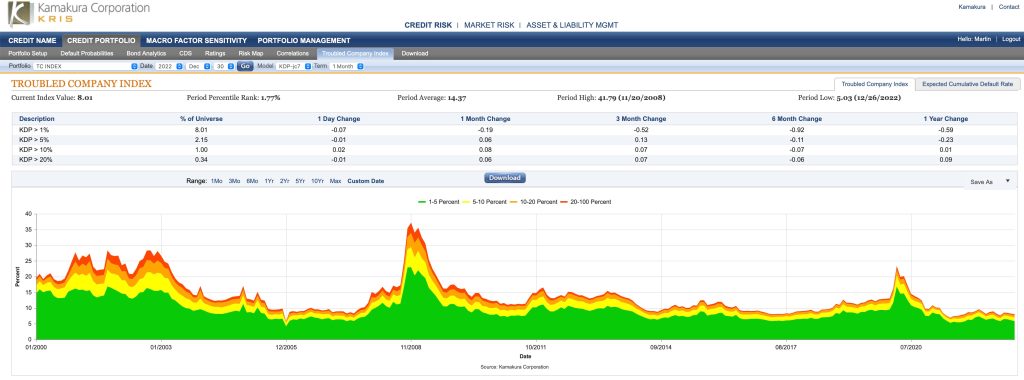
Credit conditions improved slightly to the 98th percentile of the period from 1990 to the present. The 100th percentile indicates the best credit conditions during that period. The Kamakura Troubled Company Index closed December at 8.01%, compared to 8.20% the month before. The index measures the percentage of 41,500 public firms worldwide with an annualized one-month default probability of over 1%. An increase in the index reflects declining credit quality, while a decrease reflects improving credit quality.
At the end of December, the percentage of companies with a default probability between 1% and 5% was 5.86%. The percentage with a default probability between 5% and 10% was 1.15%. Those with a default probability between 10% and 20% amounted to 0.66% of the total; those with a default probability of over 20% amounted to 0.34%. Short-term default probabilities ranged from a low of 7.79% on December 27 to a high of 8.24% on December 20. The most significant change was among the percentage of riskiest companies over 5%, which increased while the overall index improved.
Figure 1: Troubled Company Index — December 30, 2022
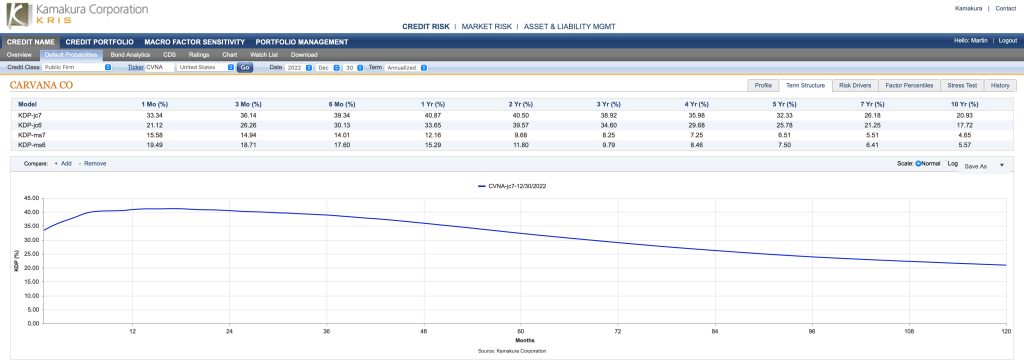
At the end of December, the riskiest 1% of rated public firms within the coverage universe included 11 companies in the U.S. and one each in Germany and Luxembourg. The riskiest rated firm was Carvana Co. (CVNA:NYSE), with a one-month KDP of 33.34%, up 10.60% from the previous month and up 24.23% over the past three months. The default term structure for Carvana can be seen in Figure 2. The inverted default structure is an additional factor to monitor in firms with high default risk. There were two defaults in the KRIS rated coverage universe in December, with one each in India and the United States.
Table 1: Riskiest 1% Rated Companies Based on 1-Month KDP – December 30, 2022

Figure 2: KDP Term Structure for Carvana – December 30, 2022
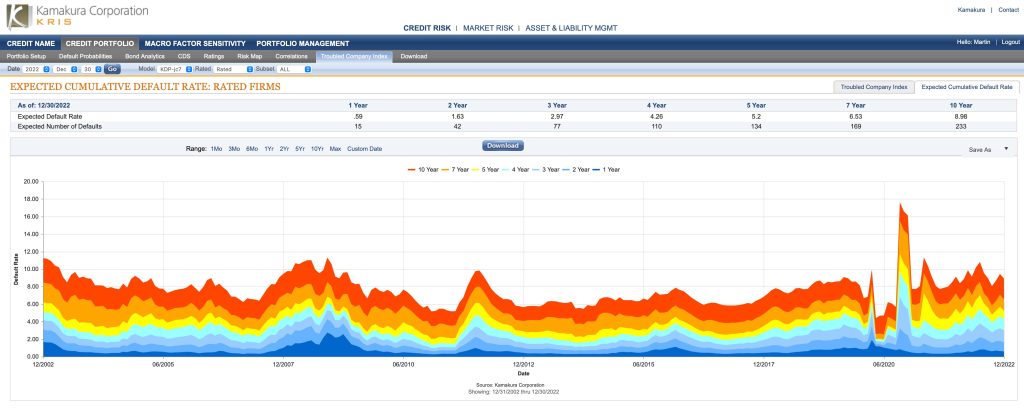
The Kamakura Expected Cumulative Default Rate, the only daily index of credit quality of rated firms worldwide, shows the one-year rate up 0.01% at 0.59%, and the 10-year rate was down slightly at 8.98%. The 3-year expected cumulative default rate is 2.97% which implies an increasing rate of defaults over the next few years.
Figure 3: Expected Cumulative Default Rate — December 30, 2022
Commentary
Stas Melnikov and Martin Zorn
SAS Institute Inc.
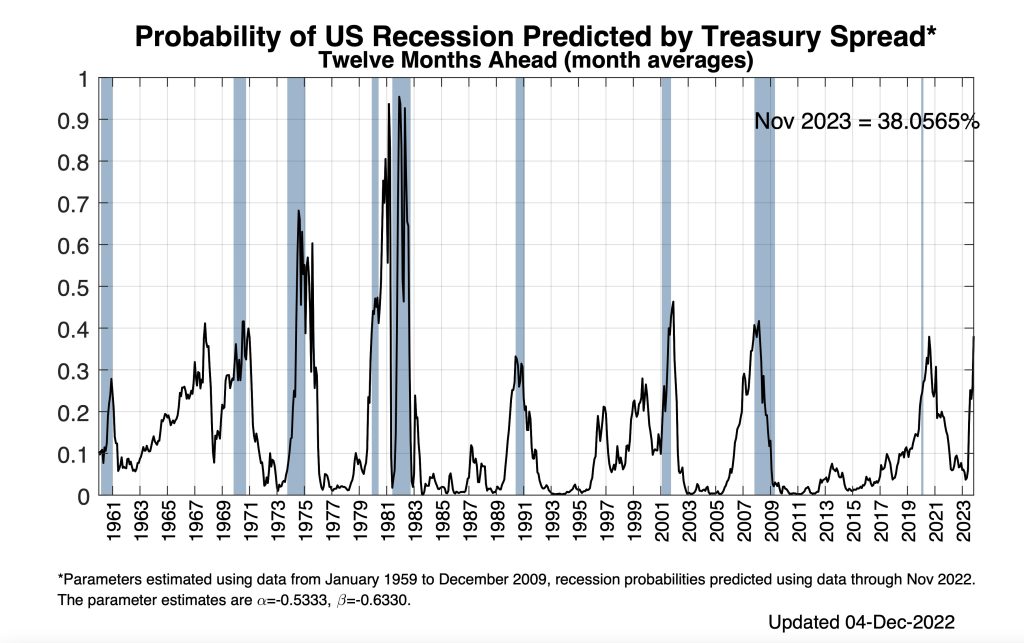
As we enter 2023, the degree of uncertainty in the markets remains high and the economic outlook, pessimistic. The Atlanta Fed’s GDPNow estimate as of December 22, 2022, illustrates this uncertainty, visible in the sharp swings up and down. While the fourth quarter looks promising in the estimate, the inverted 10-year bond minus 3-month bill rate–and the recession implications of this inversion–justify the negative outlook for 2023. A dramatic decline in consumer savings rates gives further impetus to the gloomy outlook as we enter the new year. The charts below clearly show the distortions created by post-Covid fiscal and monetary policy.
Figure 4: Federal Reserve Bank of Atlanta: GDP Now

https://www.atlantafed.org/-/media/documents/cqer/researchcq/gdpnow/RealGDPTrackingSlides.pdf
Figure 5: Treasury Spread 10 Year- 3-month Federal Reserve Bank of New York

https://www.newyorkfed.org/medialibrary/media/research/capital_markets/Prob_Rec.pdf
Figure 6: Probability of US Recession Predicted by Treasury Spread
https://www.newyorkfed.org/medialibrary/media/research/capital_markets/Prob_Rec.pdf
Figure 7: Personal Savings Rate – FRB St. Louis – FRED

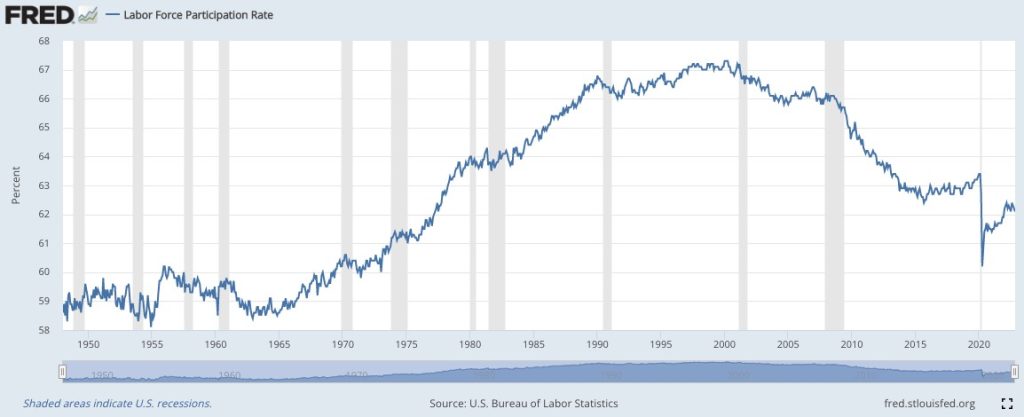
While inflation may be subsiding, it’s important to understand the long-term impact of the price increases and “shrinkflation” that have already occurred. We must also pay attention to the socioeconomic trends that have arisen since the pandemic. For example, many employees have simply disappeared from the workforce, and others resist returning to the office. The current labor force participation rate is hovering at the levels not seen in decades.
Figure 8: Labor Force Participation Rate – FRB St. Louis – FRED
In addition, given the lack of investment by natural resources companies, it is unlikely that commodity prices will retreat. The implication of these changes–along with higher interest rates and higher levels of sovereign, corporate and household debt–is that we are in the midst of a reset of factor relationships and correlations.
This is an interesting shift to ponder. How will it impact the shift from active to passive investing that we have witnessed in recent years? Will 2023 finally provide an opportunity for active investors who have the right data and models to outperform by taking advantage of the current distortions and market shifts?
A key concern is the projected increase in defaults over the next few years, even as short-term models of credit conditions continue to show low levels of distress. Slowing revenue, higher interest rates, and tightening lending conditions all point to higher probabilities of default over the next few years. While major banks are well-capitalized and not likely at risk if defaults rise, the “shadow banking” sector is untested under stress. In times of uncertainty, liquidity is always the key measure for determining which firms are best positioned to survive unexpected defaults or market disruptions.
SAS is positioned to provide all the analytics necessary to answer the myriad of questions posed by the challenges we face today.
About the Troubled Company Index
The Kamakura Troubled Company Index® measures the percentage of 41,500 public firms in 76 countries that have an annualized one-month default risk of over one percent. The average index value since January 1990 is 14.37%. Since July 2022, the Kamakura index has used the annualized one-month default probability produced by the KRIS version 7.0 Jarrow-Chava reduced form default probability model, a formula that bases default predictions on a sophisticated combination of financial ratios, stock price history, and macro-economic factors.
The KRIS version 7.0 models were developed using a data base of more than 4 million observations and more than 4,000 corporate failures. A complete technical guide, including full model test results and key parameters, is provided to subscribers. The KRIS service also includes a wide array of other default probability models that can be seamlessly loaded into Kamakura’s state-of-the-art enterprise risk management software engine, Kamakura Risk Manager. Available models include the non-public-firm default model, the U.S. bank model, and the sovereign model. Related data includes market-implied credit spreads and prices on all traded corporate bonds traded in the U.S. market. Macro factor parameter subscriptions include Heath, Jarrow, and Morton term structure models for government securities yields in Australia, Canada, France, Germany, Italy, Japan, Russia, Singapore, Spain, Sweden, Thailand, the United Kingdom, and the United States, plus a 13-country “World” model. All parameters are derived in a no-arbitrage manner consistent with seminal papers by Heath, Jarrow, and Morton, as well as Amin and Jarrow.
The version 7.0 model was estimated over the period from 1990, through the Great Recession and ending in February 2022. The 76 countries currently covered by the index are Argentina, Australia, Austria, Bahrain, Bangladesh, Belgium, Belize, Botswana, Brazil, Bulgaria, Canada, Chile, China, Colombia, Croatia, Cyprus, Czech Republic, Denmark, Egypt, Estonia, Finland, France, Germany, Ghana, Greece, Hungary, Hong Kong, Iceland, India, Indonesia, Ireland, Israel, Italy, Japan, Jordan, Kenya, Kuwait, Luxembourg, Malaysia, Malta, Mauritius, Mexico, Nigeria, the Netherlands, New Zealand, Norway, Oman, Pakistan, Peru, the Philippines, Poland, Portugal, Qatar, Romania, Russia, Saudi Arabia, Serbia, Singapore, Slovakia, Slovenia, South Africa, South Korea, Spain, Sri Lanka, Sweden, Switzerland, Tanzania, Taiwan, Thailand, Turkey, the United Arab Emirates, Uganda, the UK, the U.S., Vietnam and Zimbabwe.
About SAS
SAS is the leader in analytics. Through innovative software and services, SAS empowers and inspires customers around the world to transform data into intelligence. SAS gives you THE POWER TO KNOW®.
Editorial contacts:
- Martin Zorn – Martin.Zorn@sas.com
- Stas Melnikov – Stas.Melnikov@sas.com


