

For much of 2026, one question has dominated the technology sector: what happens to traditional software companies when artificial intelligence can write code, automate workflows, and allow customers to build applications themselves?
The resulting concern manifested in an equity selloff that has been labeled the “SaaSpocalypse.” The premise is straightforward. If AI materially reduces the cost of developing software, the economics of buying standardized software from an outside vendor may become less compelling. Vendors could face slower growth, weaker pricing power, and higher customer-acquisition costs, while products with limited differentiation may become increasingly difficult to defend.
This month’s Credit Conditions Newsletter examines the KRIS credit risk forecasts in the Information Technology sector.
To assess how credit conditions have evolved, we examined the 3,000 largest publicly listed companies in the United States at three points in time:
- December 31, 2019, before COVID-19 and the mainstream emergence of generative AI;
- December 30, 2025, before fears of widespread SaaS displacement intensified; and
- June 18, 2026 (recent snapshot).
Industry-level details for these three snapshots can be found in tables 1, 2 and 3 respectively. The tables show industry decomposition of the Information Technology GICS sector. For each industry, number of firms, combined market capitalization, 1yr cap-weighted average PD (in bps), 1yr average PD and 5yr average PD are displayed.
The comparison highlights a clear divergence between equity valuations and credit risk. While equity valuations have declined materially, the impact on public company credit risk has been more limited. Credit risk among listed software companies has increased, particularly over longer horizons, but remains at relatively low absolute levels. More pronounced deterioration is visible in the IT Services, where a smaller group of companies is driving a widening credit-risk tail.
Table 1: Information Technology Sector – Top 3000 US Companies – 6/18/2026
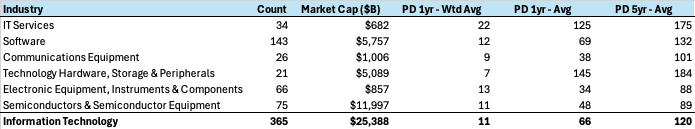
Table 2: Information Technology Sector – Top 3000 US Companies – 12/30/2025
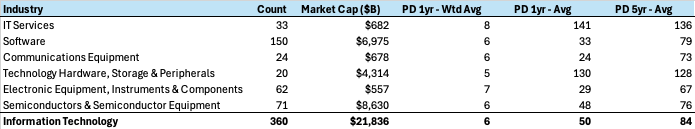
Table 3: Information Technology Sector – Top 3000 US Companies – 12/31/2019
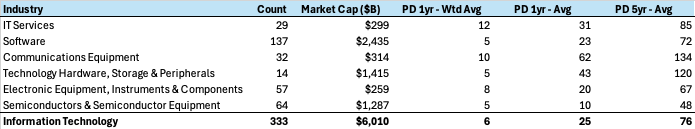
One notable data point is that market cap of the Information Technology sector more than quadrupled between 2019 and 2026. For comparison, the overall size of the US stock market roughly doubled over the same timeframe. The US Information Technology sector is now 35% of the US and 16% of the global stock market. It is worth noting that much of this staggering increase was due to the Semiconductor industry increasing 9-fold to reach $12T in market cap (with NVDA responsible for $5T of that).
The software industry lost approximately $1.2 trillion of market capitalization between December 2025 and June 2026. Credit risk also rose: the average one-year probability of default more than doubled, and the average five-year probability increased by approximately two-thirds. At the same time, the absolute levels remain modest. The market-cap-weighted one-year PD is only 12 basis points. That is twice its December level, but it remains well below what would normally indicate broad financial distress. In other words, the SaaSpocalypse has meaningfully translated into near-term default risk.
The gap between the equity and credit response is not surprising. Equity valuations are a function of expectations for long-term revenue growth and profitability. Even a modest reduction in expected growth can produce a large decline in the present value of a company whose valuation was built around rapid expansion. This is perhaps a cautionary tale for the current state of equity market as a whole, where valuations are built around lofty growth expectations. If the “E” in “P/E” changes, it can have significant impact on valuations.
Default, on the other hand, requires more. A company must experience deterioration severe enough to exhaust its cash, lose access to financing or become unable to meet its contractual obligations. Many publicly listed software companies entered 2026 with significant financial cushions. They can experience valuation compression, slower growth and lower margins without approaching default. They can also reduce hiring, cut discretionary spending, moderate stock-based compensation or pursue strategic transactions before debt service becomes impaired. This helps explain why a severe equity repricing has produced only a moderate increase in near-term public-company default probabilities.
It also explains why the five-year PD has moved more (in bps) than the one-year weighted average. The main concern is not whether AI causes immediate defaults. It is whether persistent disruption gradually weakens revenue durability, pricing power and refinancing capacity. Careful monitoring of credit conditions is warranted, especially in this sector. This is where the daily updated default probabilities from KRIS can help monitor these dynamics, providing visibility into issuer-level deterioration as it develops.
It is important to note that the relatively moderate results for the listed software companies should not be extrapolated to the entire technology ecosystem. Private software companies are often at an earlier stage of the development and as a result have less diversified revenue, weaker or negative free cash flow and fewer financing alternatives. Many were acquired or financed when interest rates were lower and software valuation multiples were substantially higher. Their debt structures typically depend on continued revenue growth, sponsor support and/or an eventual refinancing or sale.
Software has also become a major component of private credit portfolios. Bank for International Settlements research estimated that loans to SaaS companies exceeded $500 billion by the end of 2025, representing approximately 19% of direct lending. Private lenders may therefore face a different transmission mechanism. Falling software valuations reduce sponsor equity cushions and make exits more difficult. Furthermore, asset-light companies may offer limited tangible collateral in a restructuring.
The IT Services industry presents a different picture. Unlike software, credit deterioration in IT services is already visible across both average and market-weighted measures. The average one-year PD was already elevated at the end of 2025. It declined modestly by June, from 141 to 125 basis points, but remains approximately four times its 2019 level. More concerningly, the average five-year PD increased from 136 to 175 basis points. The market-cap-weighted one-year PD also rose sharply, from 8 to 22 basis points. This indicates that deterioration is not confined to outliers but is increasingly reflected at the industry level.
This industry classification covers a heterogeneous group of companies. It includes traditional outsourcing and infrastructure-management providers, staffing and consulting firms, cloud platforms, data-center operators, and newer AI-related infrastructure companies. Not all are exposed to the same risks. In fact, some of those companies have benefitted greatly from the AI boom.
AI may improve productivity, but it can also reduce demand for labor-intensive implementation, support and application maintenance work. In the current environment their clients gain bargaining power, seeking shorter contracts, greater flexibility and measurable productivity savings. Legacy service providers must simultaneously invest in AI capabilities, modernize delivery platforms and migrate customers away from lower-margin services. This creates a structurally challenging transition: providers must fund transformation even as customers expect those investments to translate into lower future costs.
Table 4 provides company-level details for the IT Services industry. It is worth noting that some of the riskier companies on that list according to KRIS are rated investment grade.
Table 4: IT Services Industry Detail (PD in bps) – 6/18/2026
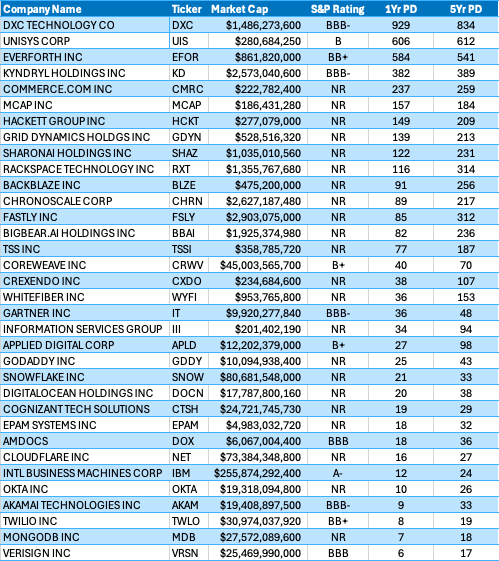
At the top of the list (riskiest companies) are DXC – tech consulting and outsourcing; UIS – tech solutions; EFOR – IT services and solutions; KD – tech services. There is a common theme across the riskiest companies – exposure to labor-intensive, less differentiated IT services.
Providers dependent on legacy outsourcing, staffing volumes or undifferentiated implementation work face pricing pressure and potential revenue erosion, when combined with leverage and limited financial flexibility. The most exposed companies tend to combine three characteristics: high reliance on legacy or labor-intensive services, limited differentiation or pricing power, and constrained balance sheets.
While AI is increasing demand for IT services, the bifurcation is also happening here. The specialized AI consultants and hyperscalers are capturing this increased demand, while legacy IT service providers struggle. Thus, AI is consequently unlikely to eliminate the IT-services industry. However, it is likely to compress legacy revenue streams, redistribute margins toward stronger providers, and accelerate credit differentiation across the sector. This is therefore an area to monitor from a credit perspective, particularly for providers with limited ability to adapt.
Credit Conditions Summary – Top 3000 US Firms
For the United States top 3000 firms the median PDs continue to be elevated, down slightly compared to prior month. Cap-weighted PDs have risen from their cycle lows and now stand at the levels consistent with historic averages.
Figure 1: Market Cap-Weighted Cumulative Default Probability – Top 3000 Companies in the US
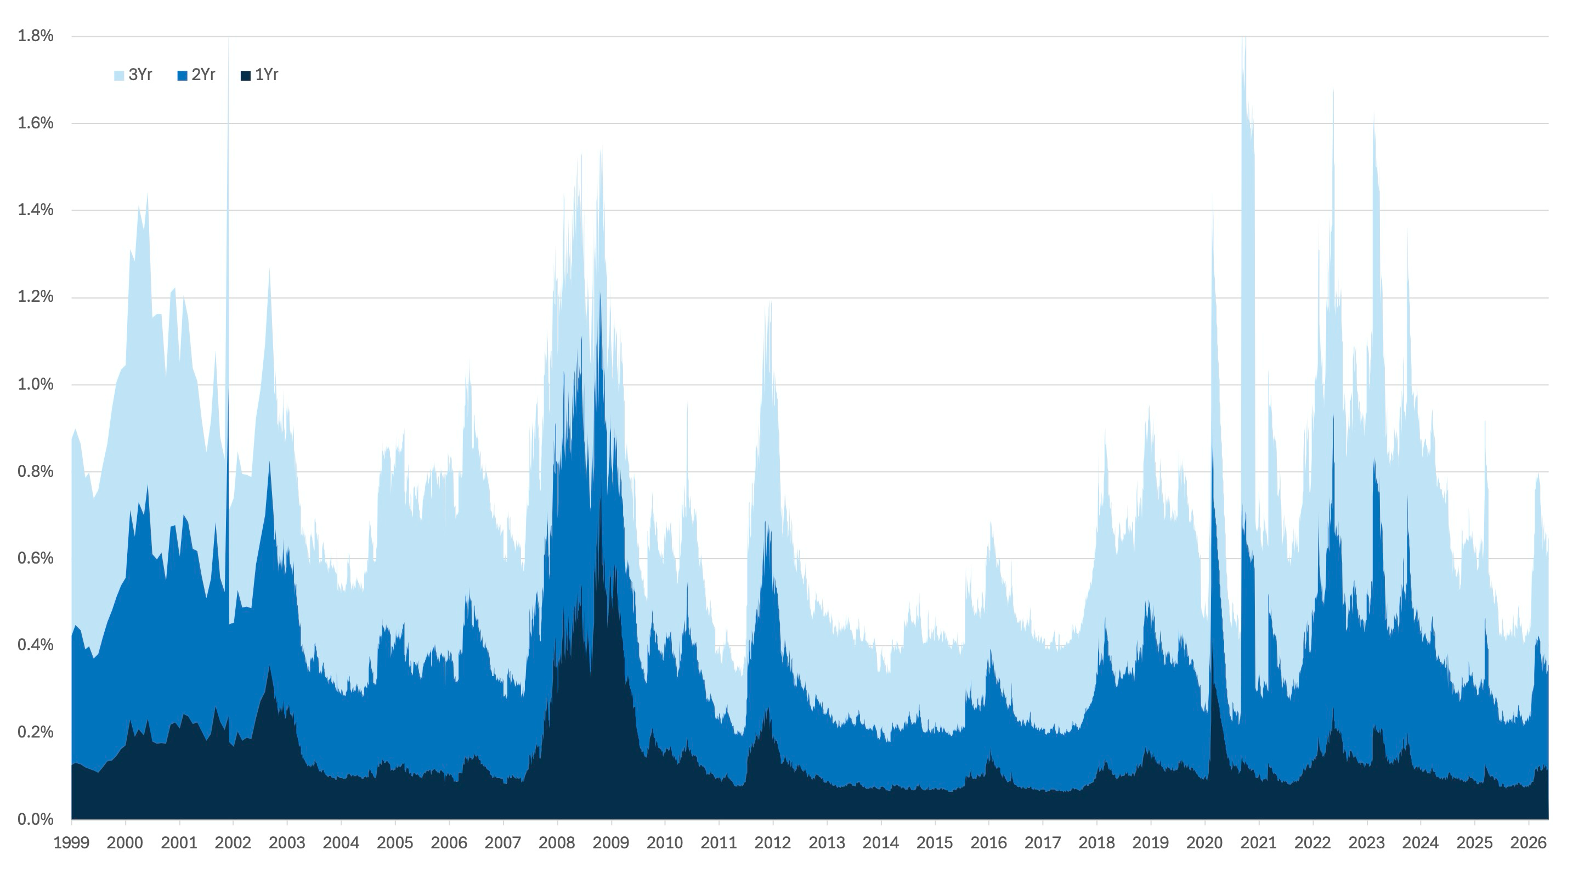
Figure 2: Median Cumulative Default Probability – Top 3000 Companies in the United States
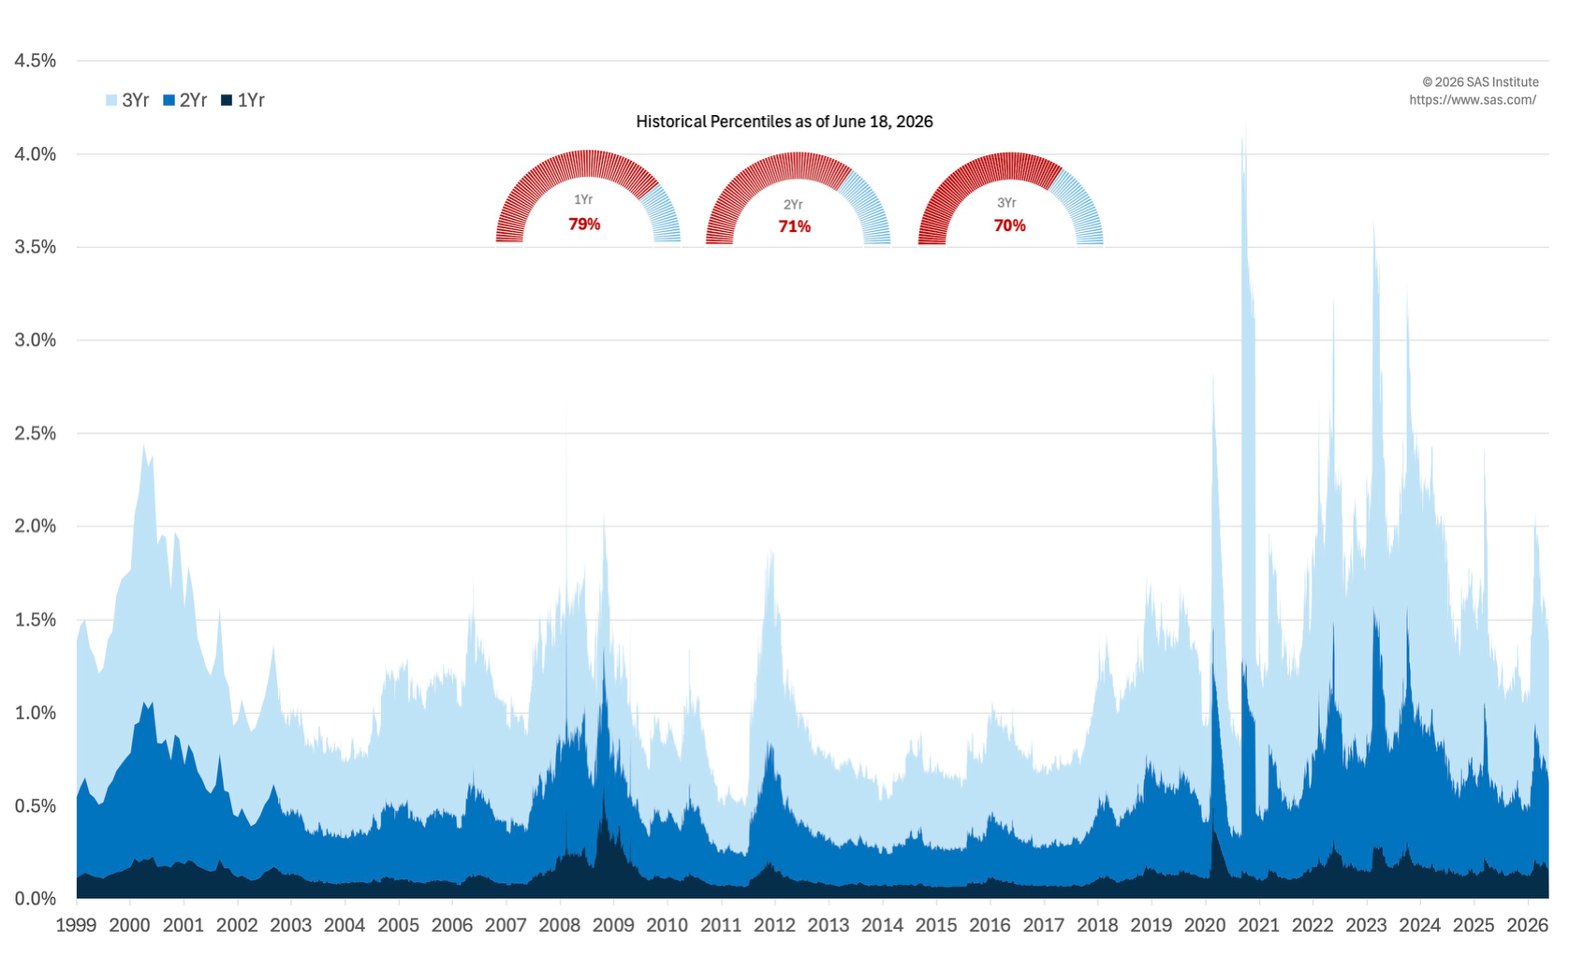
Table 5: Market Cap-Weighted Average 1-year Default Probability (Top 3000 Firms in the United States)
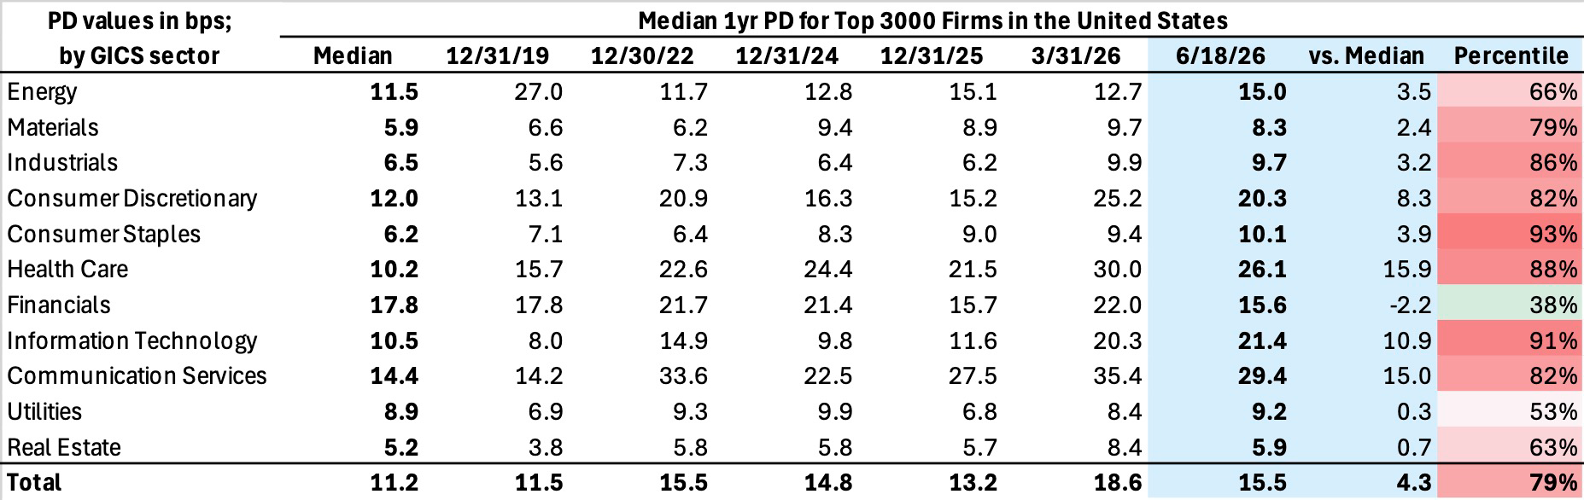
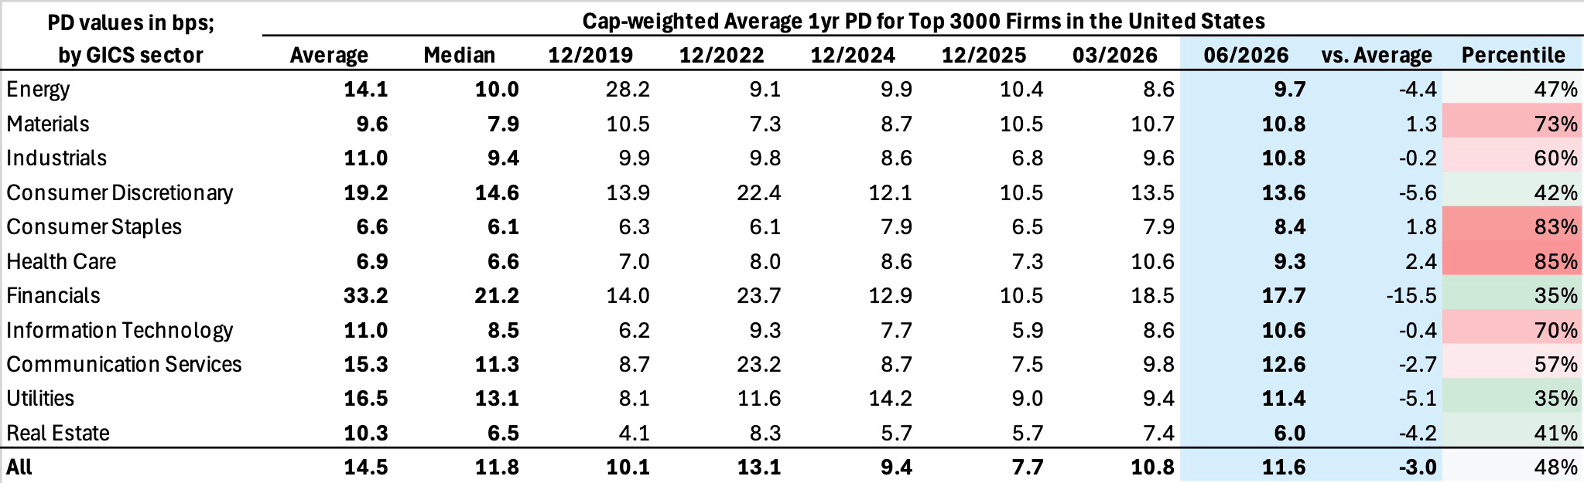 Table 6: Median 1-year Default Probability (Top 3000 Firms in the United States)
 Why KRIS PD forecasts matter now. Market prices can remain calm even as underlying risk becomes more concentrated, making model‑based, issuer‑level signals increasingly important. KRIS default probabilities provide daily, issuer‑level signals that help make this bifurcation visible: pinpointing names where refinancing pressure, equity‑volatility shocks, or weakening coverage metrics are emerging even when credit spreads do not move. Used alongside market spreads and fundamental analysis, PDs help identify risks that are not yet fully priced, providing actionable early‑warning signals.
Appendix
Table 7: Riskiest Rated Companies Based on 1-year PD
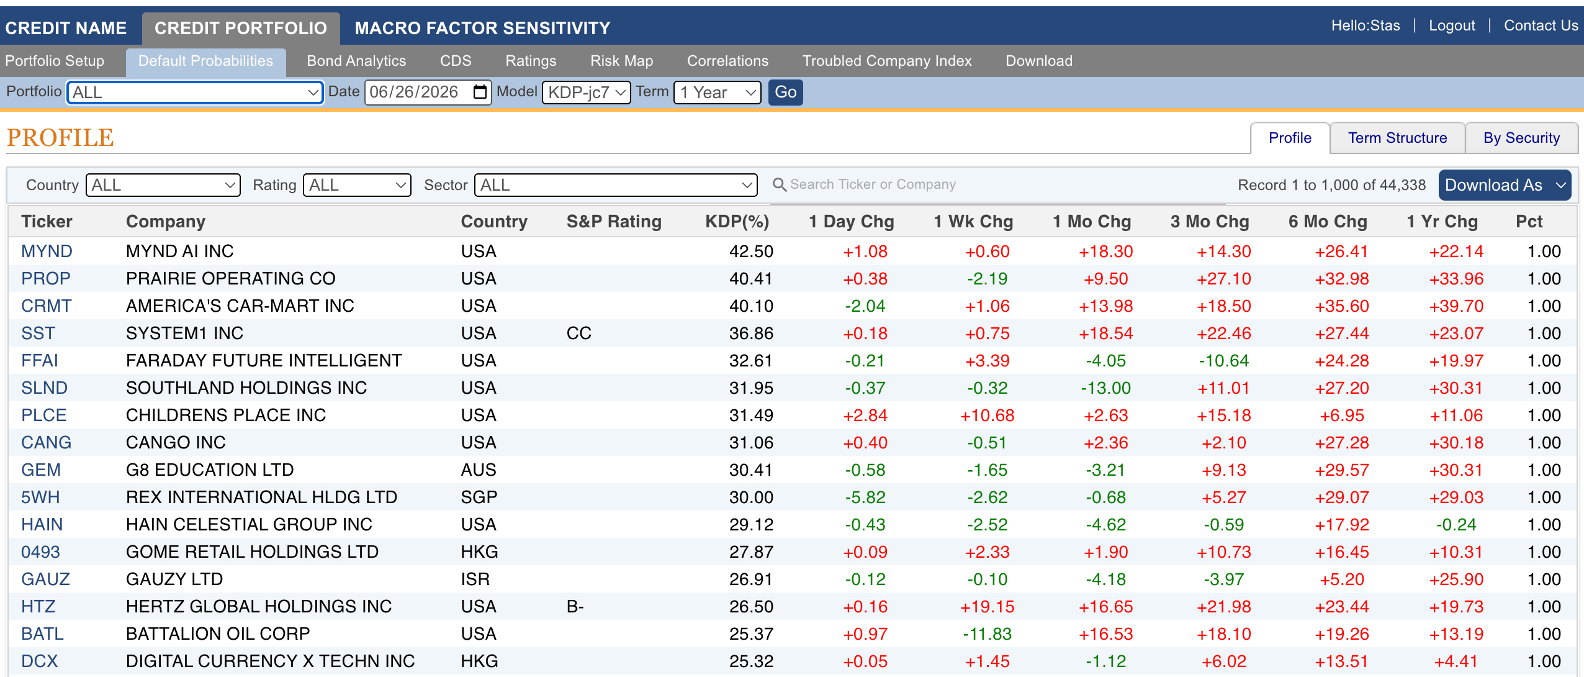
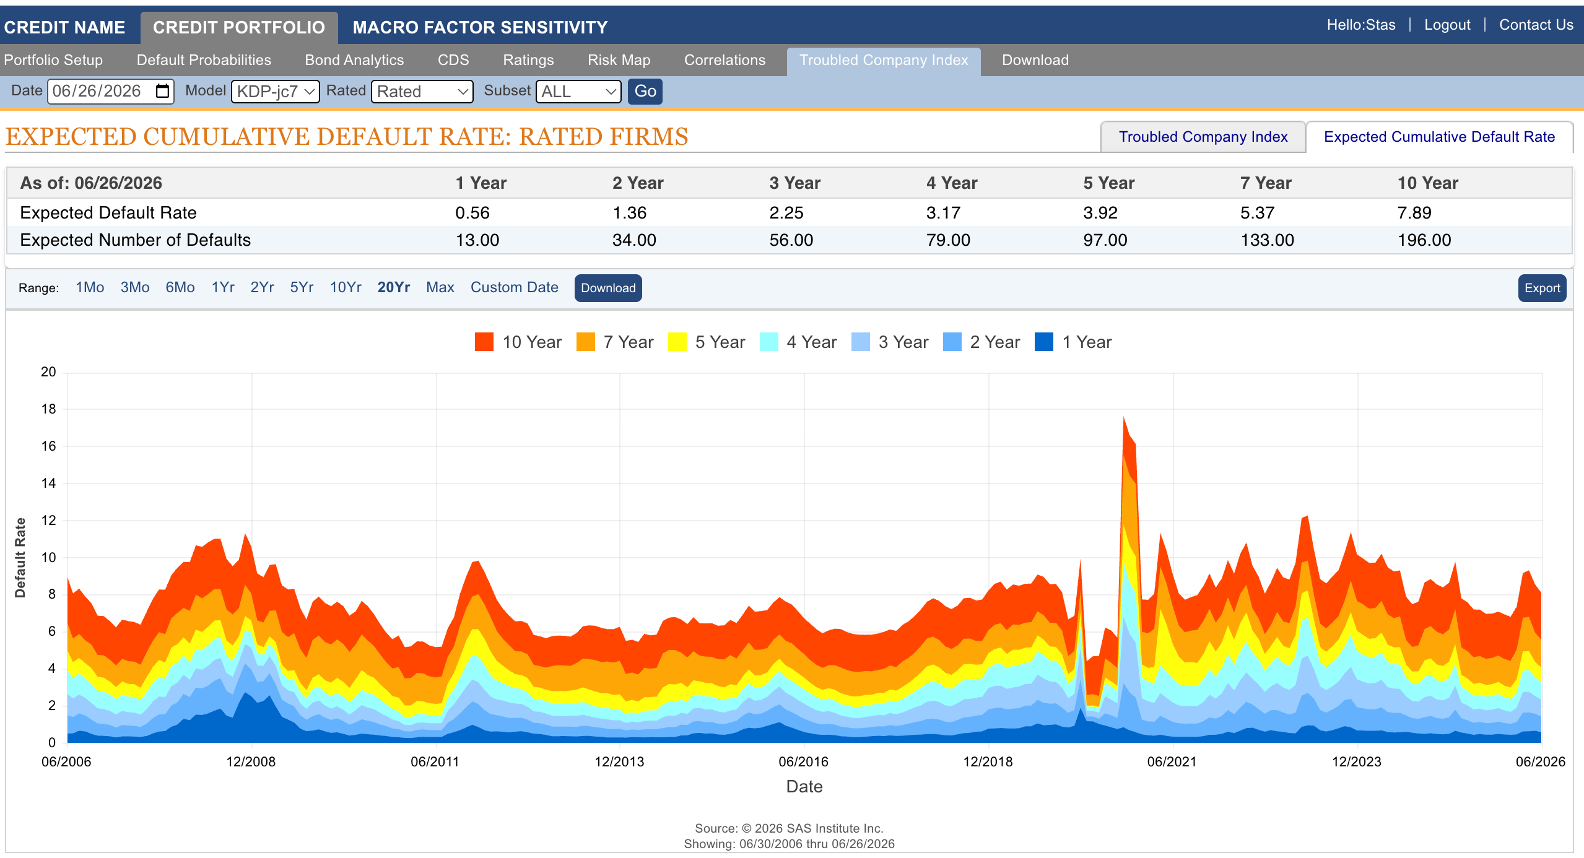
Figure 3: Expected Cumulative Default Rates
About SAS
SAS is the leader in analytics. Through innovative software and services, SAS empowers and inspires customers around the world to transform data into intelligence. SAS gives you THE POWER TO KNOW®.
Editorial contact: Stas Melnikov – stas.melnikov@sas.com