

December capped a year in which headline growth and risk-on positioning coexisted with rising under-the-surface strain—a late-cycle mix that kept markets calm while widening the gap between credit “winners” and “losers.” Continuing the trends of outperformance, the US Q3 GDP posted an upwards surprise indicating that the economy grew at a 4.3% annualized rate. Acceleration in the consumer spending was responsible for most of the change. Interestingly some of the largest contributors to the consumer spending growth were health care services and prescription drugs.
With the growth story tailwinds, the markets continued to march higher. As we close 2025, the equity risk premium has been squeezed to unusually thin levels (near zero) and, depending on the earnings yield measure, occasionally negative: meaning investors are accepting little (or no) extra compensation for equity risk versus Treasuries[1].
At the same time, stress in small caps persisted: roughly 40% of Russell 2000 constituents are unprofitable (negative trailing earnings), leaving the index unusually sensitive to refinancing conditions and liquidity. This is consistent with our credit outlook that shows elevated levels of stress in smaller companies. As higher interest rates continue to pressure overleveraged borrowers, the absence of earnings makes debt refinancing difficult. Based on KRIS model-implied expected default counts, small-cap firms are expected to generate defaults at roughly 15x the quantity of the large-cap segment. The separation between large and small caps has widened over time. Last month this newsletter focused on the bifurcation among the U.S. households[2]. This month, the focus shifts to corporates.
While much attention has been paid to the “Mag 7” over the past few years, the evolution of equity-market size and composition extends well beyond a handful of tech winners. Figure 1 displays the evolution of the market-capitalization size needed to be in the top 10 (the darkest blue line on the chart), top 1,000, and top 3,000 (the lightest blue line). One can view these delineations as mega-cap (1–10), large cap (1–1,000), and small cap (1,000–3,000). The values of the cutoff points are indexed to Jan 2000 levels to make the trends comparable.
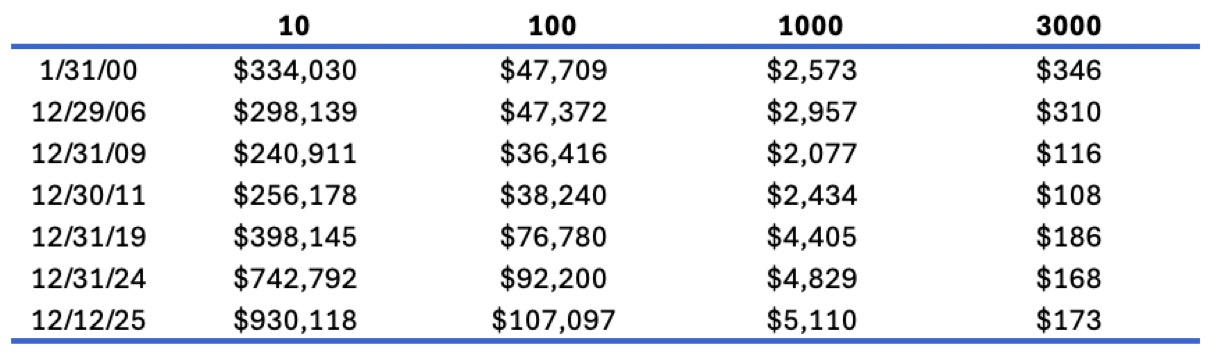
In the early 2000s, leading up to the GFC (Global Financial Crisis), the relative positioning of the cutoffs remained mostly stable. Adjusted for inflation (Table 2), the market-cap cutoffs were virtually unchanged between 2000 and 2006. The GFC was an inflection point: bifurcation accelerated. Large companies recovered much faster, with the large-cap/small-cap delineation moving from $3B in 2006 to $4.4B in 2019 in inflation-adjusted dollars. The threshold to be included in the top 3,000, however, dropped from $310M to $186M over the same period.
Large-company market caps rose much faster, while smaller companies shrank in inflation-adjusted terms. There are many possible explanations for this trend, including a decline in the number of publicly traded companies and larger firms benefiting disproportionately from GFC-era bailouts and post-GFC stimulus. Regardless of the drivers, the fact is that market-cap dispersion increased significantly. Another noteworthy observation is that the top 10 cutoff was relatively stable leading into this decade. The AI-driven rise of mega-cap tech moved that cutoff dramatically. To be included among the largest 10 companies in the U.S. required a market cap of $334B at the beginning of this century versus $398B at the end of 2019 (inflation-adjusted). Over the next five years, that cutoff more than doubled to reach $930B at the end of 2025. During the same period the LC/SC threshold barely moved. It appears that the definition of winners narrowed considerably.
Figure 1: Market Cap Cutoff by Size Rank (Indexed to Jan 2000 = 100)
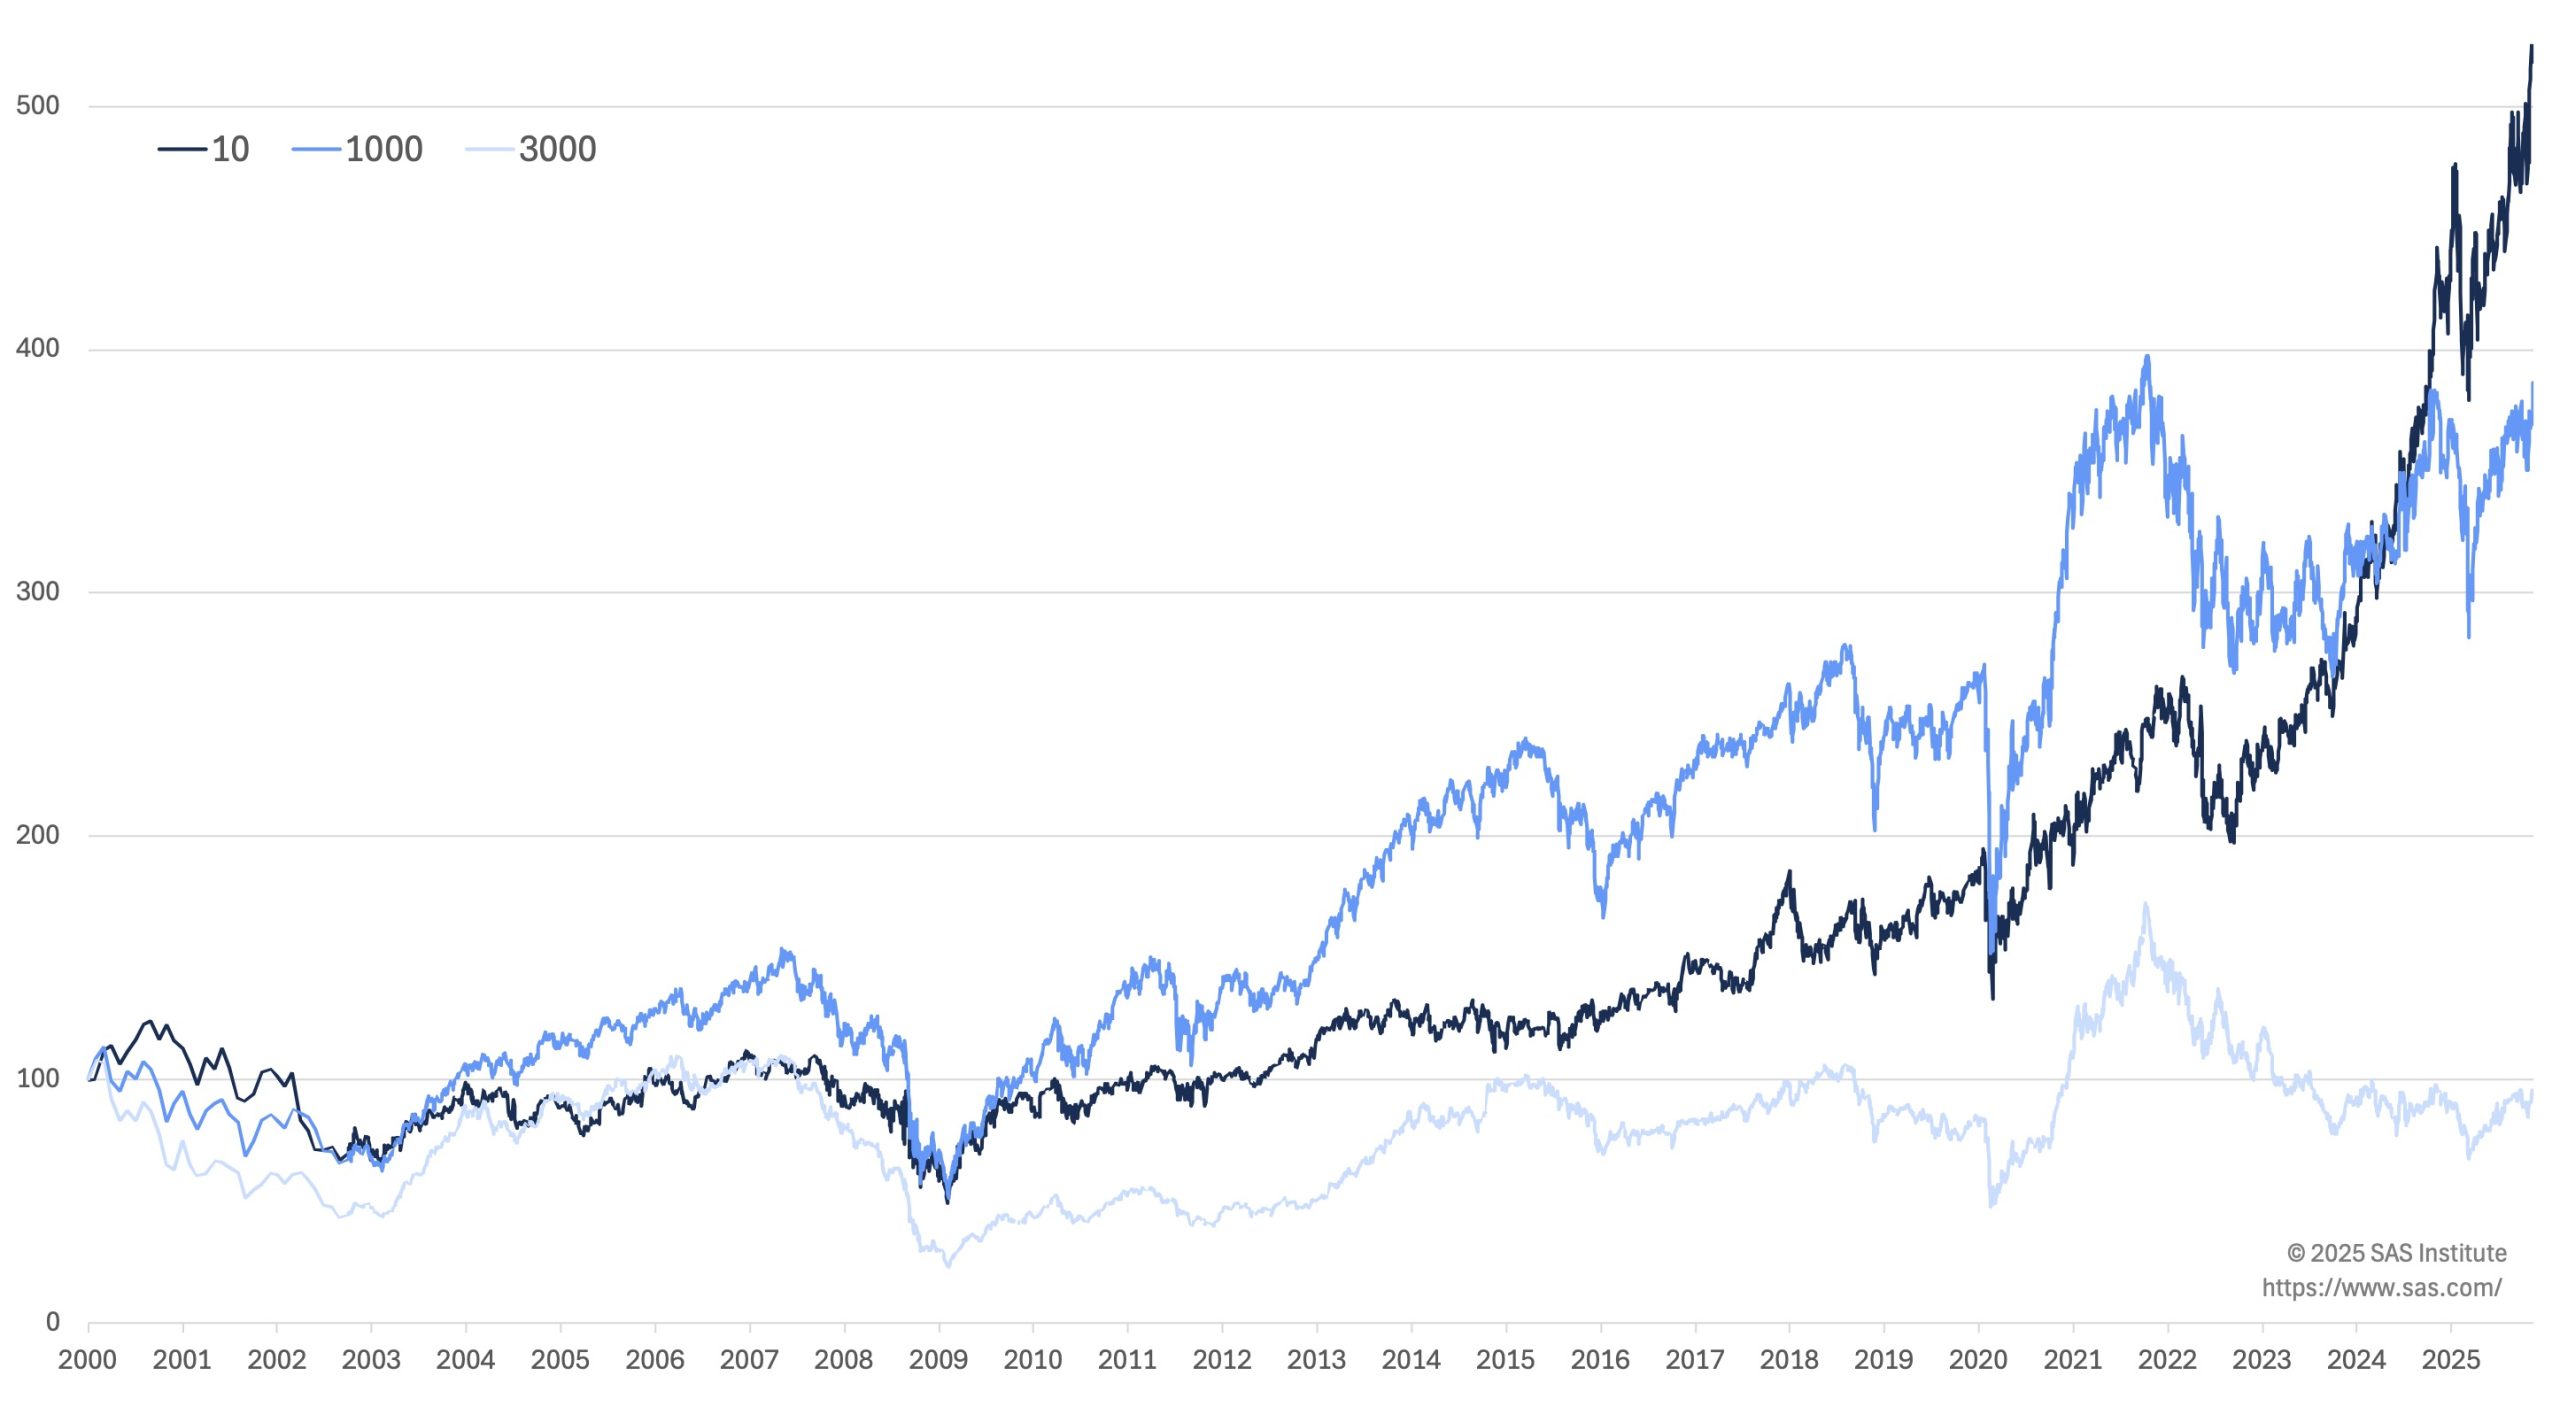
Table 1: Market Cap Cutoff Values by Rank in USD millions
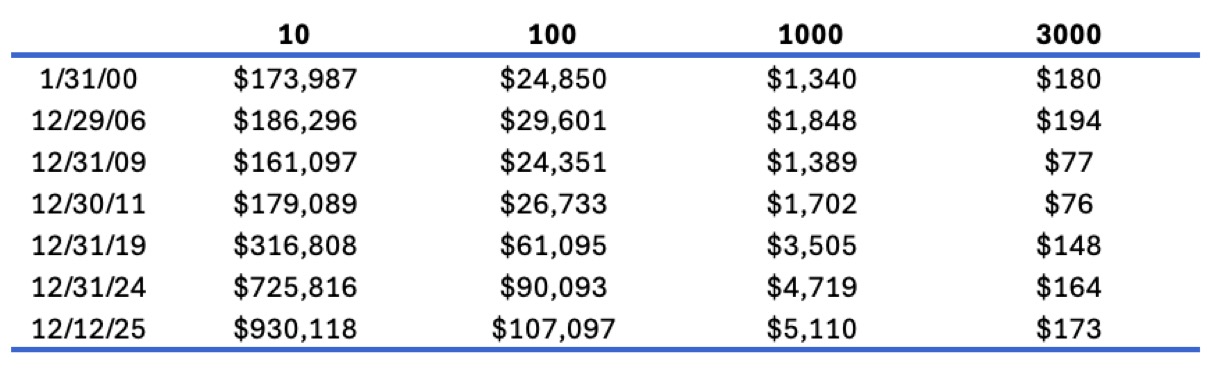
Table 2: Inflation-Adjusted Market Cap Cutoff Values by Rank in USD millions (in 2025 dollars)
The key question going forward is whether the growth from top 10 will trickle down to the rest of the market. I suspect that much of that will depend on whether the productivity gains from AI will materialize over the next few years.
U.S. Default Outlook
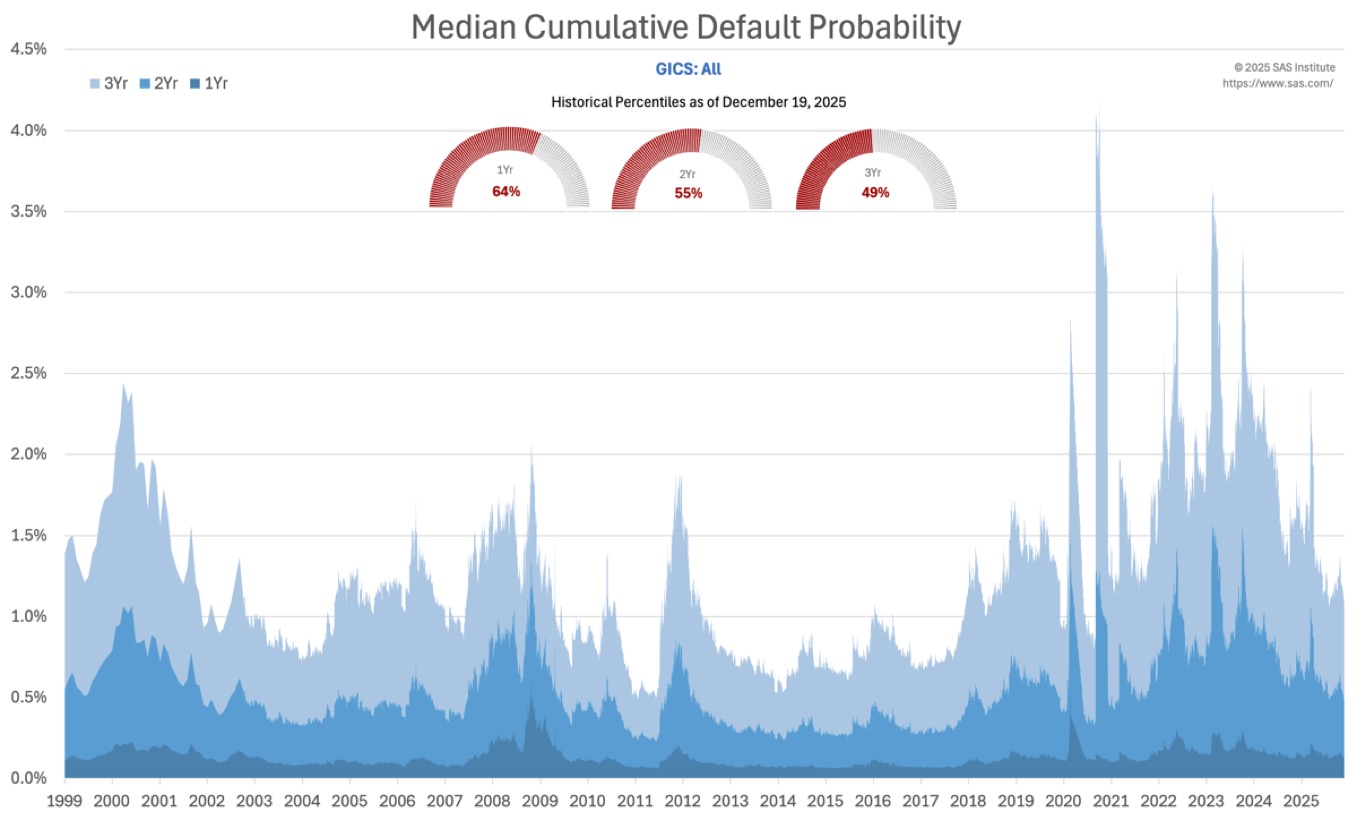
Consistent with better than expected results of December, KRIS[3] median cumulative default probability (non-cap weighted) values have shown marginal improvement. The 1yr PD is now in the 64th percentile of its historical distribution (with 100th being the worst outlook). The smaller companies are clearly struggling, and the models continue to reflect that stress.
Figure 2: Median Cumulative Default Probability – Top 3000 Companies in the United States
Sector Analysis
Table 3 benchmarks each GICS sector against its long-run median using 1yr KDP measure. The Median column represents the median value of the daily median KDP values going back to 1999. The columns that follow show historical snapshots of the median 1yr KDP, and the last two columns quantify how far the latest snapshot sits above its historical median and where it ranks in percentile terms.
Table 3: Median 1-year Default Probability (Top 3000 Firms in the United States)
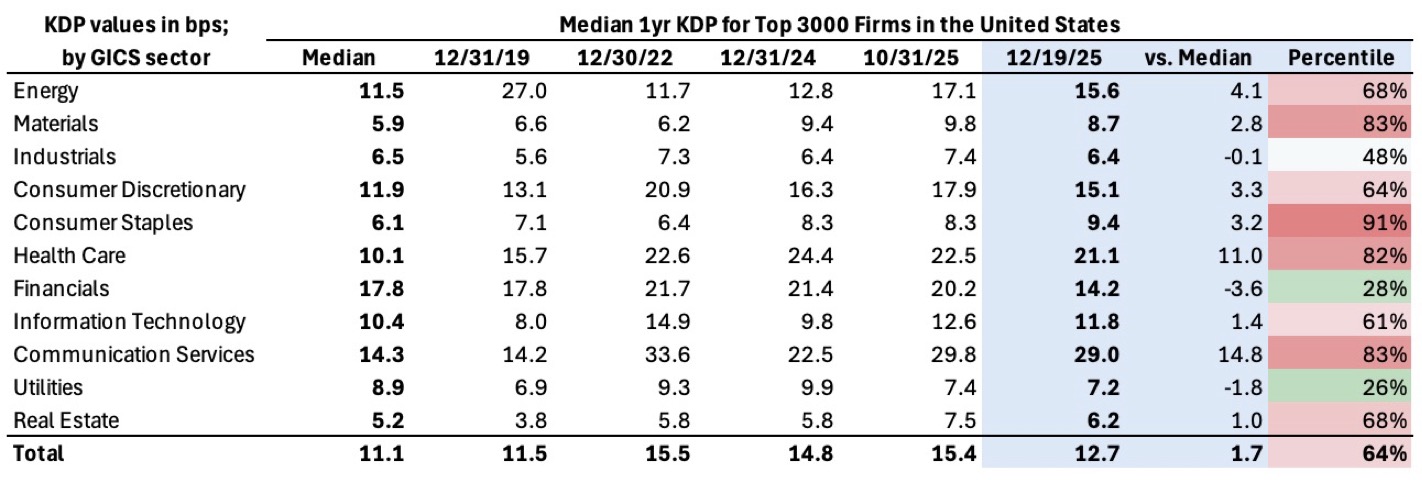
Most of the sectors are still well above their historical medians. However, looking at medians tells only a part of the story. Figure 3 highlights the dispersion of default probabilities by sector for 12/31/2019 and 12/19/2025, shown as box-and-whisker plots. The whiskers represent the 5th and 95th percentiles. The side-by-side comparison suggests that dispersion has widened in several sectors since the pre-COVID period. Consumer Staples, traditionally among the lowest-risk sectors, stands out for a meaningful upward shift in both its median probability and the width of its distribution.
Figure 3: 1yr Default Probability Distribution by Sector (5%/25%/75%/95%) – Top 3000 Companies in the United States
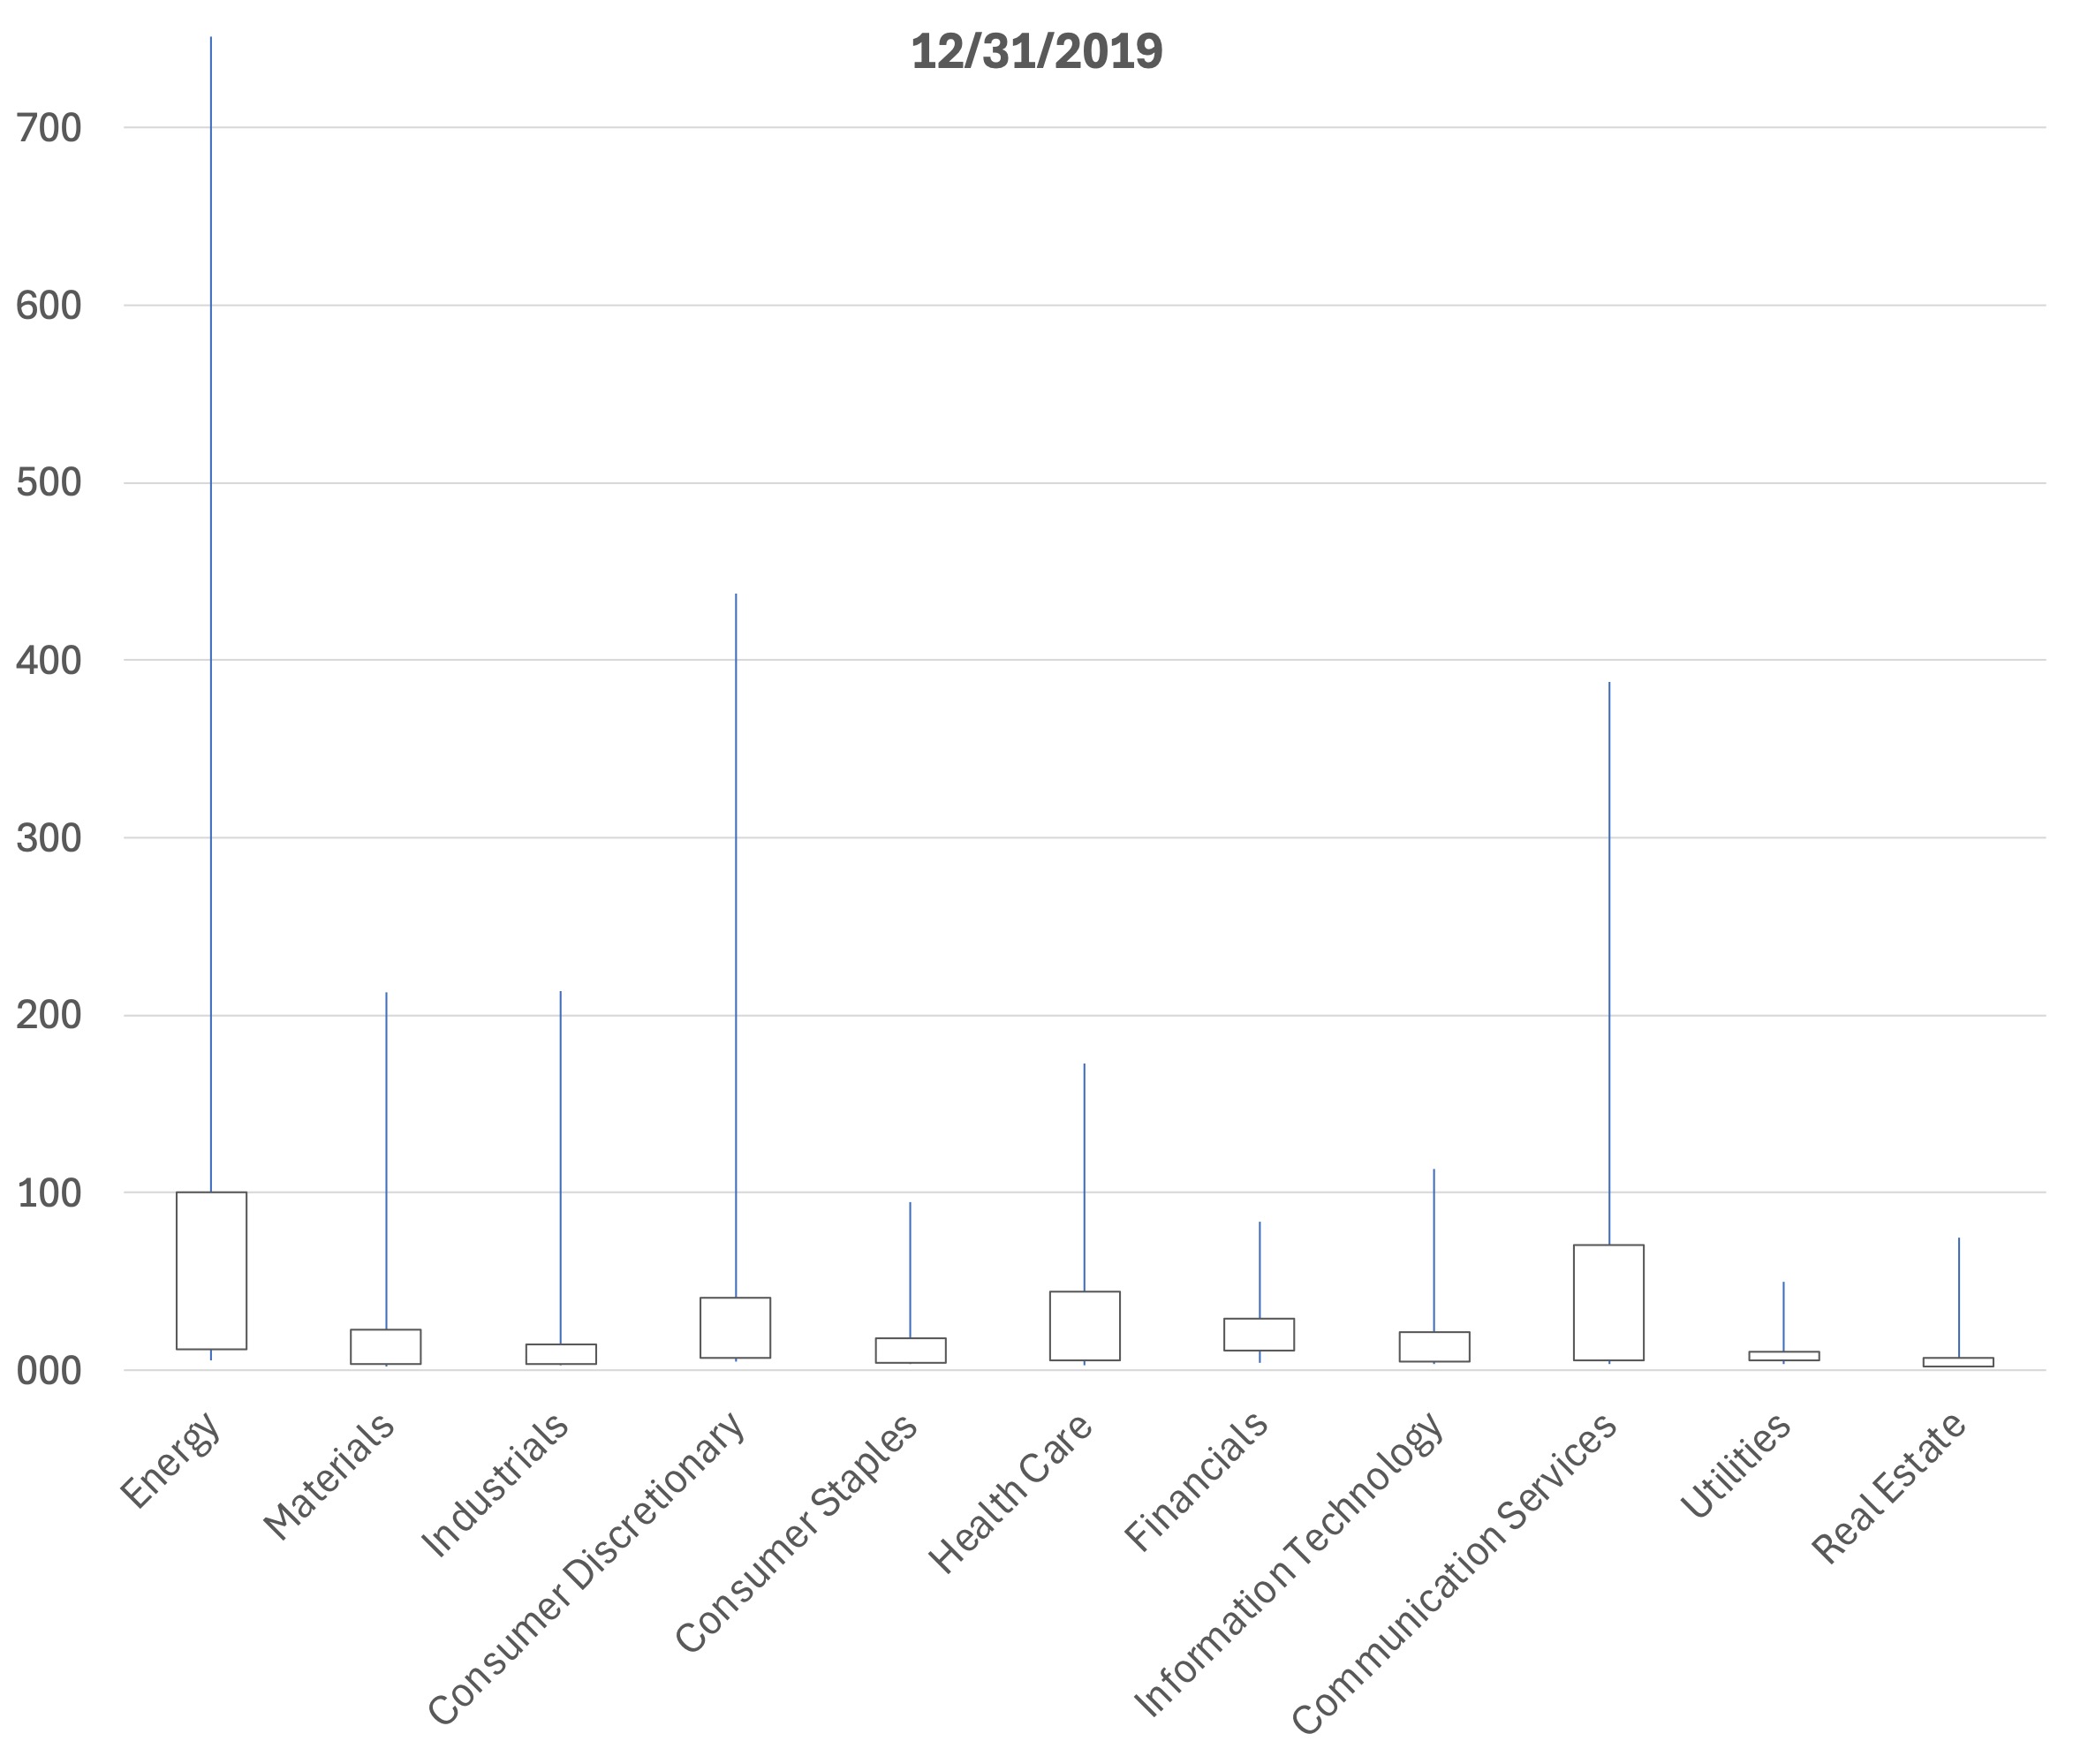
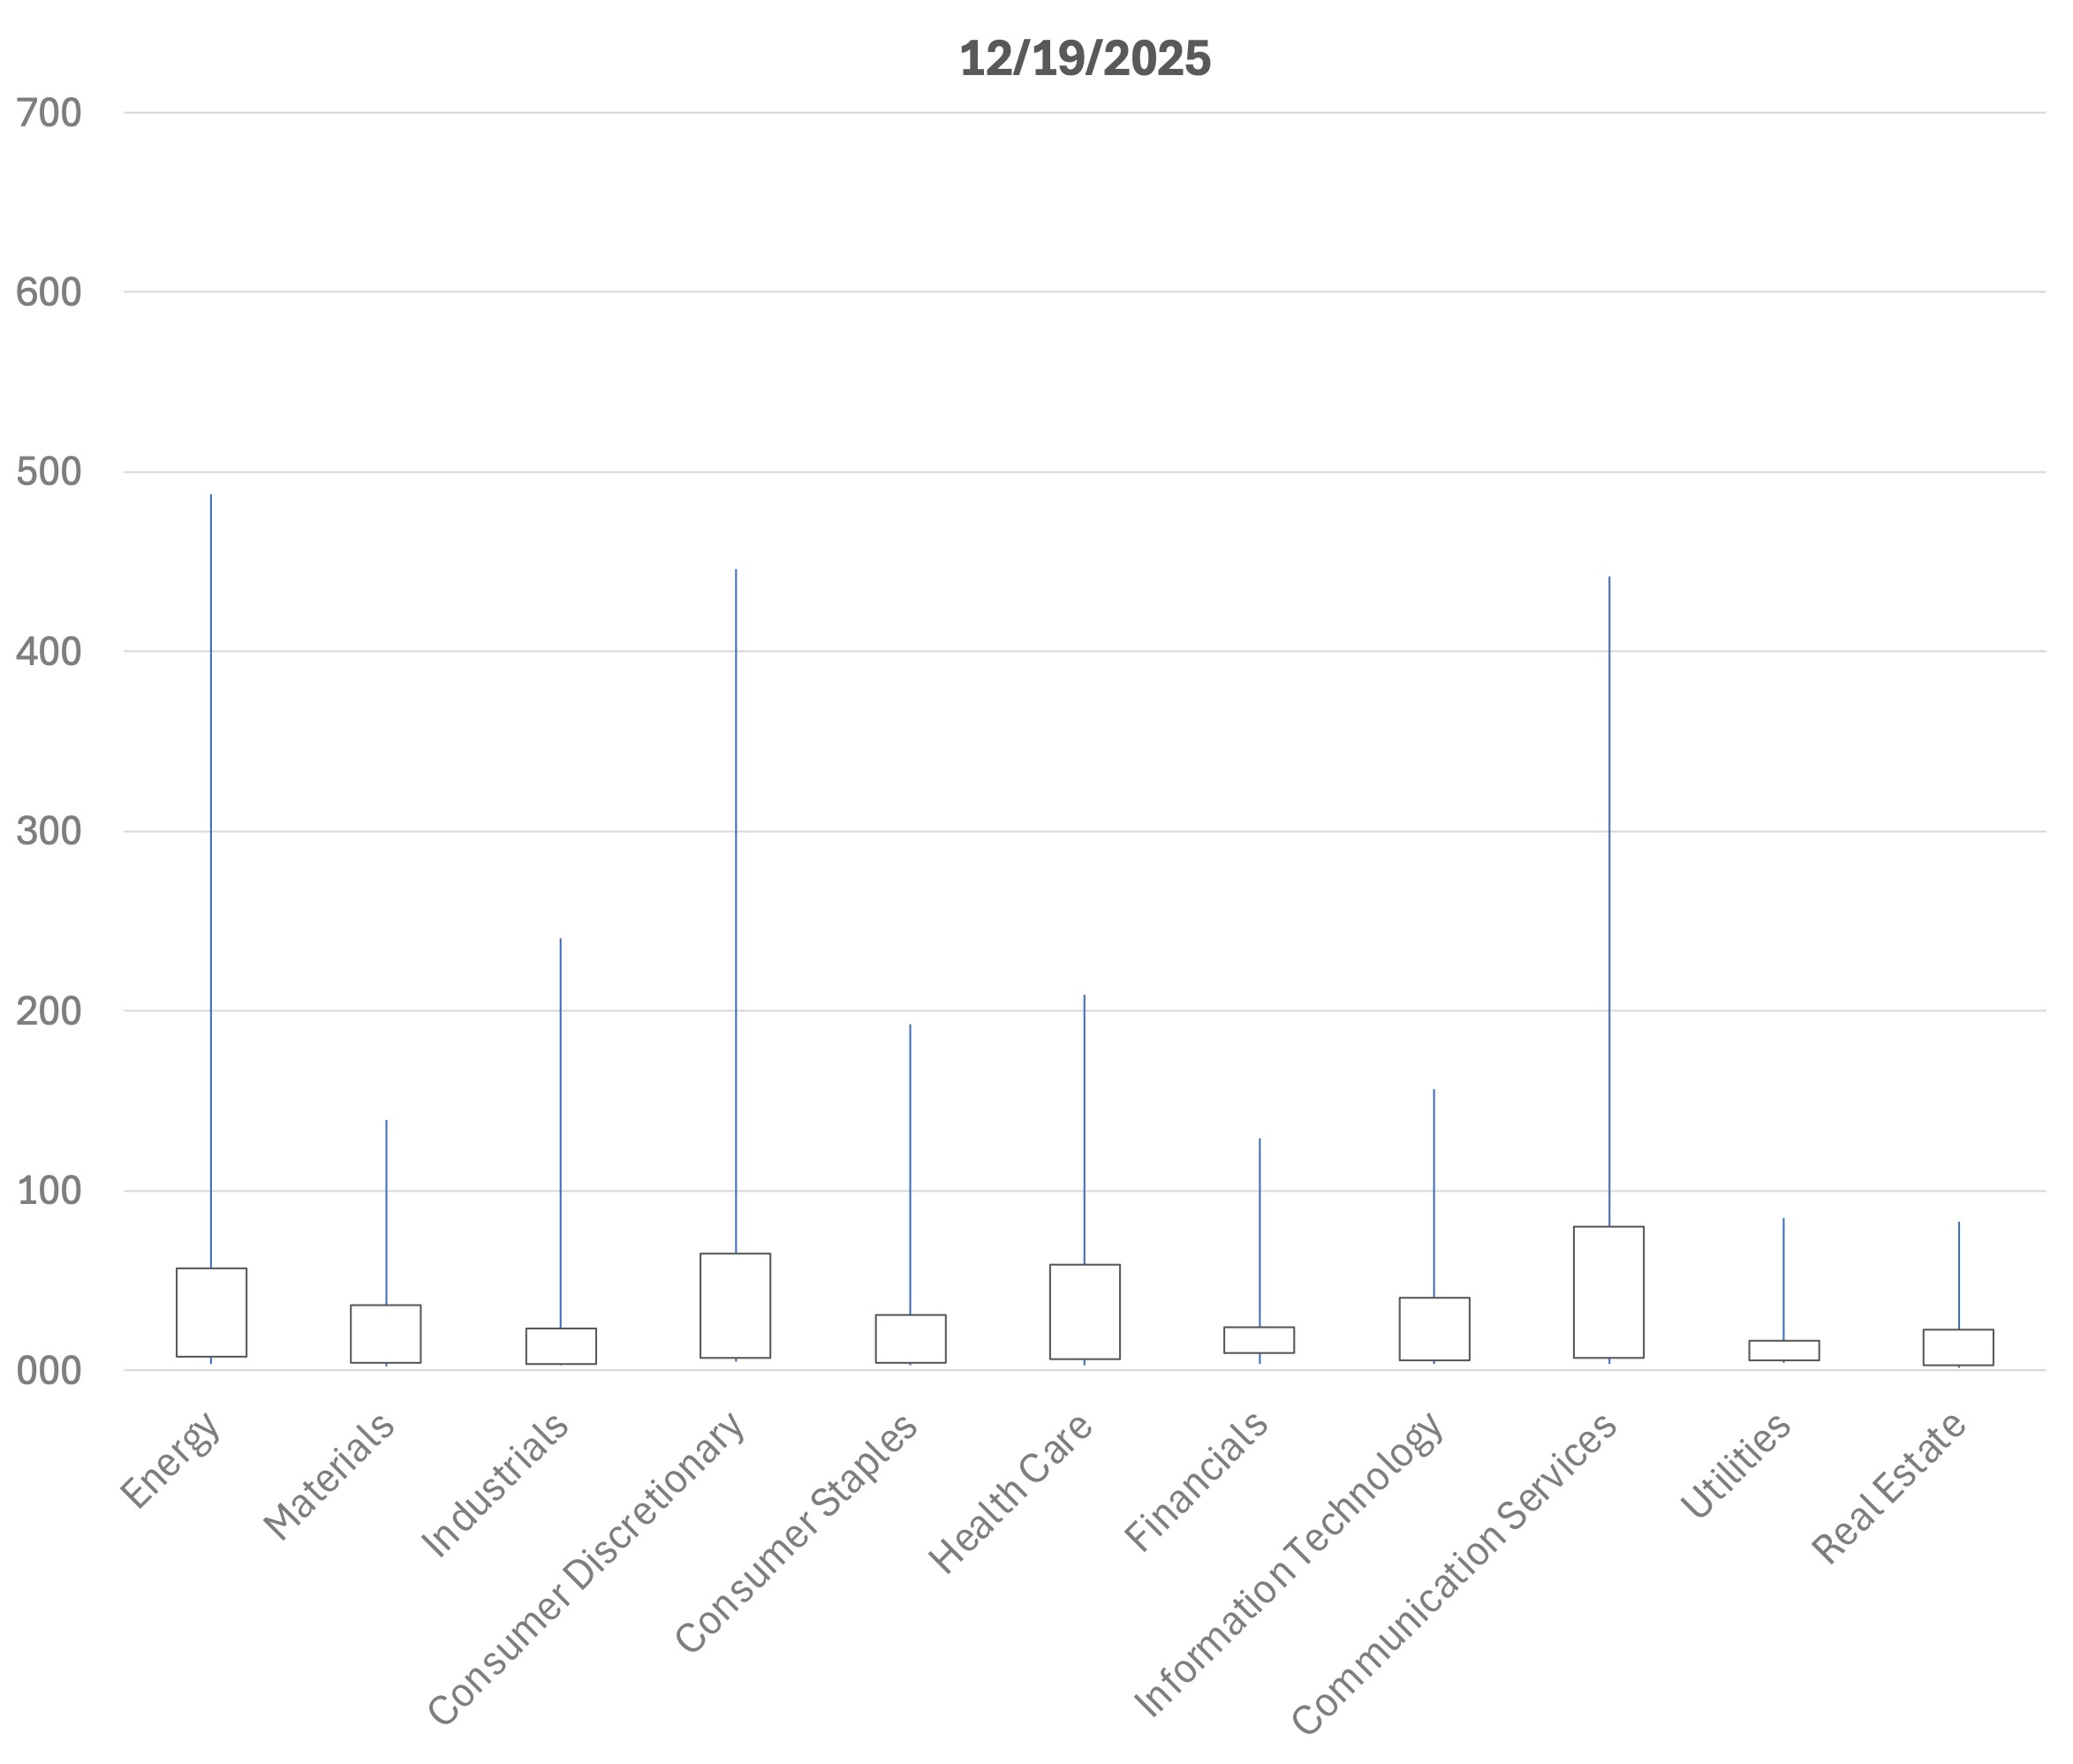
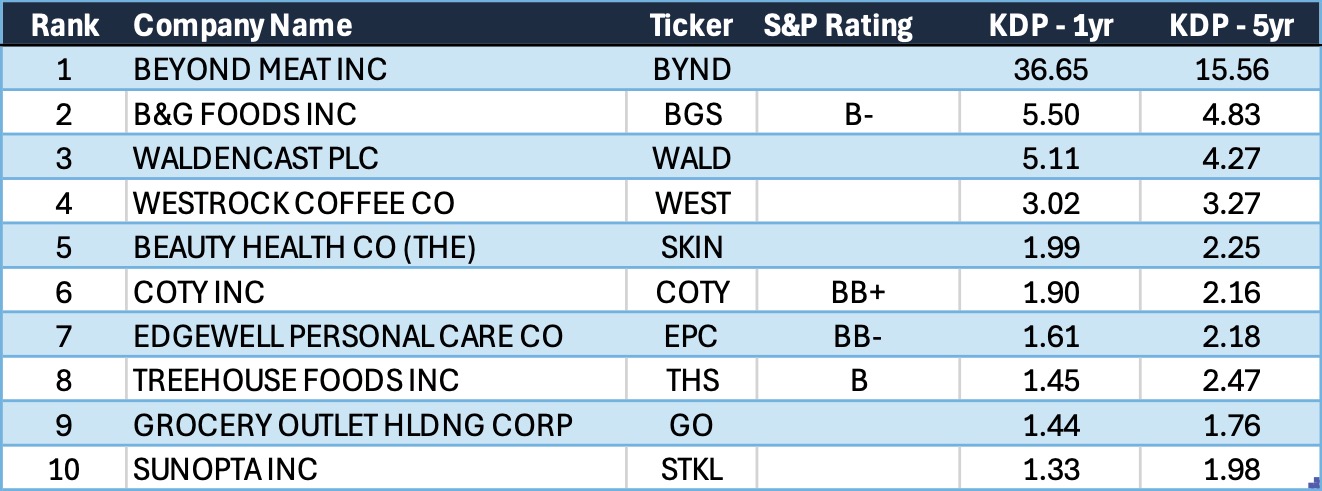
Table 4 provides the issuer-level detail behind the right tail of the Consumer Staples distribution.
Table 4: Consumer Staples – Top 10 Riskiest Companies (as of 12/19/25) – KDP in bps
There are some idiosyncratic stories as well as common themes:
- Category disruption + leverage is a toxic mix. The structural shift in demand for plant-based meats has been especially punishing for specialized producers such as Beyond Meat (BYND). Combined with very high leverage, the setup becomes fragile. Under our expanded default definition (economic harm to creditors), the company has already experienced a “default-like” event via a liability management exercise: $1.15B of convertible notes due 2027 were exchanged into $202.5M of new senior secured second lien PIK toggle notes due 2030 plus 326M shares of BYND equity[4]. While the transaction reduced near-term debt-service pressure, it did so by imposing substantial impairment on the original creditors. Despite the restructuring, the modeled probability of subsequent default remains elevated.
- Discretionary-adjacent staples are being repriced as discretionary credits. While this analysis is for Consumer Staples, the boundary between “staples” and “discretionary” is not always clean. Beauty is a good example, with multiple names appearing in the tail (WALD, SKIN, COTY). The combination of softening demand in certain mass segments, realignment in distribution channels (including a more prominent role for e-commerce such as Amazon), and more cautious retailer ordering has pressured earnings. This is another sign that consumer stress is not limited to the cyclical categories.
- Tariffs and input-cost shocks are amplifying working-capital and margin pressure. Several tail names cite adverse tariff dynamics. Most notably, WEST raised capital (convertible notes and equity) to address higher working-capital needs driven by coffee price dynamics and tariffs. Other issuers have flagged tariff headwinds as part of broader cost pressure, including EPC, COTY, and BGS. Even when costs are ultimately passed through, the timing of pass-through can tighten liquidity.
- Leverage and refinancing exposure remain the common accelerants. Most names in the top-10 tail are highly leveraged—necessary but not sufficient for stress. What matters now is that leverage is colliding with higher-for-longer financing costs, tighter lender tolerance, and a market that rewards scale and consistency.
Consumer Staples is still “defensive” at the index level, but the distribution has changed: the sector’s tail increasingly contains smaller, more leveraged issuers facing a mix of higher-for-longer financing costs, retailer/private-label dynamics, tariff and input-cost uncertainty, and category-level demand shifts (notably within plant-based and certain discretionary-adjacent staples categories like beauty). That combination explains why the median PD can rise alongside dispersion.
Why KRIS KDP matters now. Market prices can remain calm even as underlying risk concentrates, making model-based, issuer-level signals essential. KRIS default probabilities provide daily, issuer-level signals that make the bifurcation visible – pinpointing names where refinancing pressure, equity-vol shocks, or weakening coverage are rising even when spreads don’t budge. Used alongside market spreads and fundamentals, KDPs help identify issues not yet priced, providing actionable early warnings.
Contemporaneous Credit Conditions
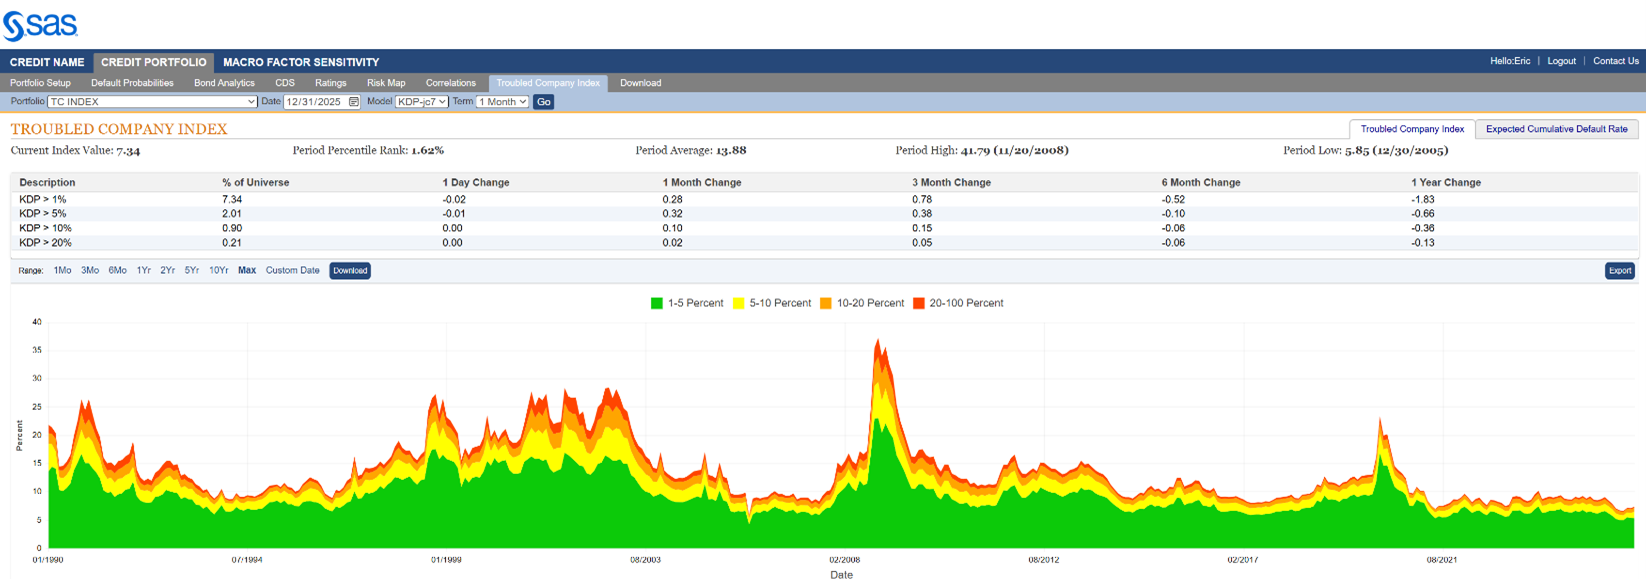
The Kamakura Troubled Company Index® closed the month of December at 7.34%, up 0.28% from the prior month. The index measures the percentage of 42,514 public firms worldwide with an annualized one-month default probability of over 1%. An increase in the index reflects declining credit quality, while a decrease reflects improving credit quality.
At the end of December, the percentage of companies with a default probability between 1% and 5% was 5.33%. The percentage with a default probability between 5% and 10% was 1.11%. Those with a default probability between 10% and 20% amounted to 0.89% of the total; and those with a default probability of over 20% amounted to 0.21%. For the month, the percentage of companies with a short term default probability over 1% ranged from a low of 7.00% on December 4th to a high of 7.37% on December 23rd.
Figure 4: Troubled Company Index®, December 31st, 2025
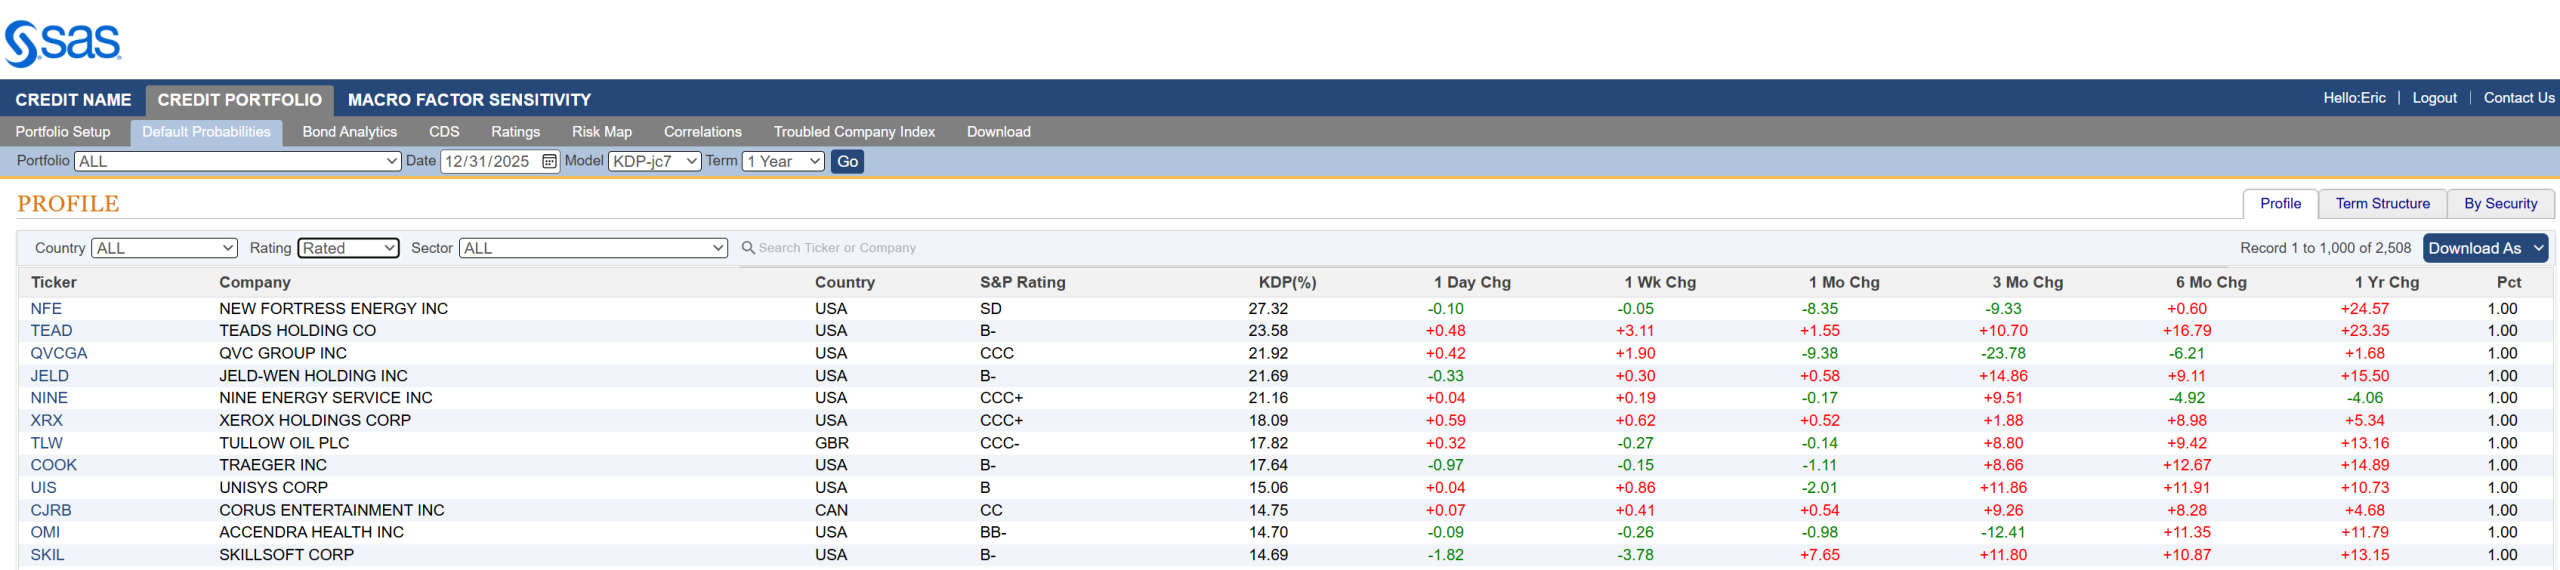
At the end of December, the riskiest 1% of rated public firms within the coverage universe as measured by 1-month default probability included ten companies in the U.S. , one in Canada and one in the UK. NEW FORTRESS ENERGY INC (NASDAQ:NFE) is the riskiest rated firm in our universe, with a 1-month KDP of 27.32%–down 10.12% over the past month.
Table 5: Riskiest Rated Companies Based on 1-month KDP, December 31st, 2025
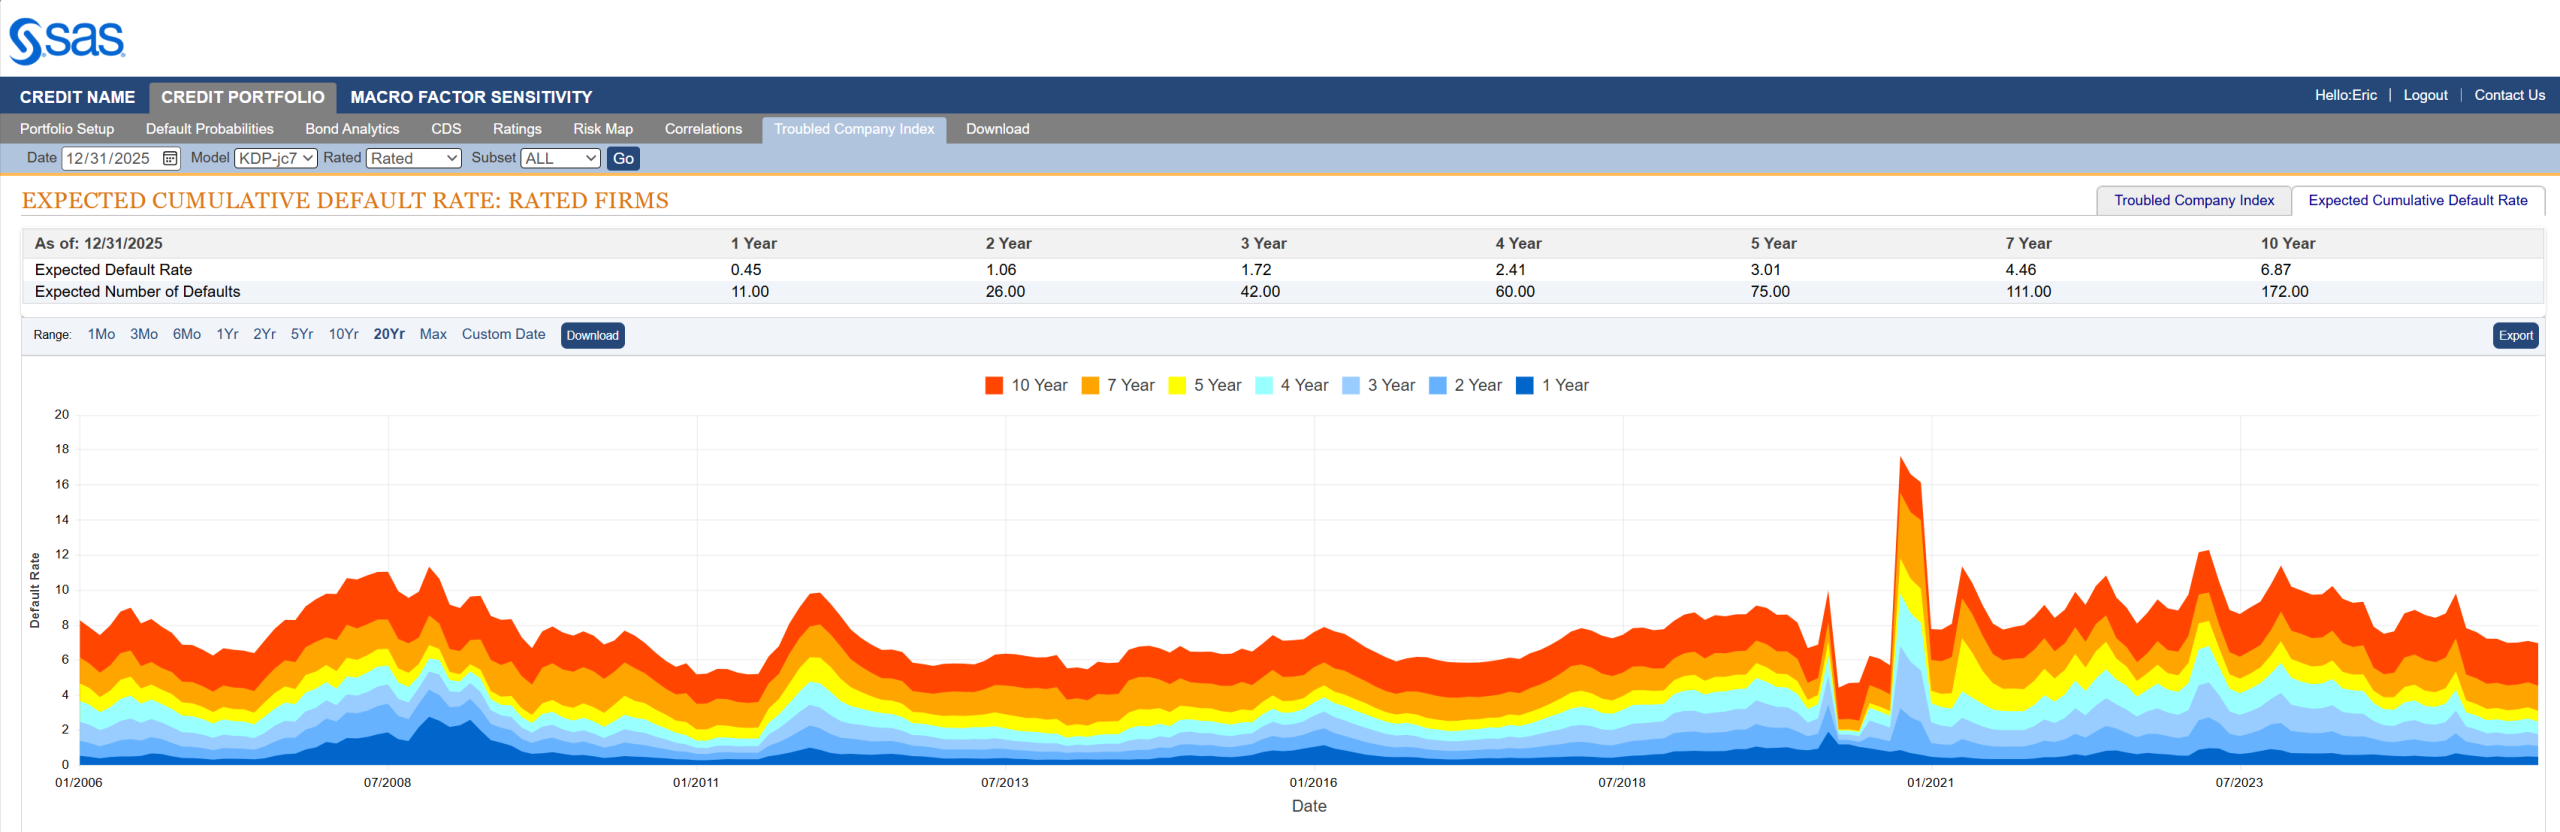
The Expected Cumulative Default Rate, the only daily index of credit quality of rated firms worldwide, shows the one-year rate of 0.45% down 0.13% from the prior month, with the 10-year rate down 1.32% at 6.87%.
Figure 5: Expected Cumulative Default Rates, December 31st, 2025
About the Troubled Company Index
The Kamakura Troubled Company Index® measures the percentage of 42,500 public firms in 76 countries that have an annualized one-month default risk of over one percent. The average index value since January 1990 is 13.94%. Since July 2022, the index has used the annualized one-month default probability produced by the KRIS version 7.0 Jarrow-Chava reduced form default probability model, a formula that bases default predictions on a sophisticated combination of financial ratios, stock price history, and macro-economic factors.
The KRIS version 7.0 models were developed using a data base of more than 4 million observations and more than 4,000 corporate failures. A complete technical guide, including full model test results and key parameters, is provided to subscribers. Available models include the non-public-firm default model, the U.S. bank model, and the sovereign model.
The version 7.0 model was estimated over the period from 1990, through the Great Recession and ending in February 2022. The 76 countries currently covered by the index are Argentina, Australia, Austria, Bahrain, Bangladesh, Belgium, Belize, Botswana, Brazil, Bulgaria, Canada, Chile, China, Colombia, Croatia, Cyprus, Czech Republic, Denmark, Egypt, Estonia, Finland, France, Germany, Ghana, Greece, Hungary, Hong Kong, Iceland, India, Indonesia, Ireland, Israel, Italy, Japan, Jordan, Kenya, Kuwait, Luxembourg, Malaysia, Malta, Mauritius, Mexico, Nigeria, the Netherlands, New Zealand, Norway, Oman, Pakistan, Peru, the Philippines, Poland, Portugal, Qatar, Romania, Russia, Saudi Arabia, Serbia, Singapore, Slovakia, Slovenia, South Africa, South Korea, Spain, Sri Lanka, Sweden, Switzerland, Tanzania, Taiwan, Thailand, Turkey, the United Arab Emirates, Uganda, the UK, the U.S., Vietnam and Zimbabwe.
About SAS
SAS is the leader in analytics. Through innovative software and services, SAS empowers and inspires customers around the world to transform data into intelligence. SAS gives you THE POWER TO KNOW®.
Editorial contacts:
- Stas Melnikov – Stas.Melnikov@sas.com
- Eric Penanhoat – Eric.Penanhoat@sas.com
[1] Proxy: S&P 500 earnings yield minus the 10-year Treasury yield.)
[2] https://www.kamakuraco.com/three-years-post-chatgpt/
[3] https://www.sas.com/en_my/software/kris.html
[4] https://www.sec.gov/Archives/edgar/data/1655210/000119312525240364/d60690d8k.htm