

In the November 2025 newsletter, we examined how US household wealth changed after the release of ChatGPT. Household wealth rose sharply over that period, but the gains were highly concentrated. Most of the increase came from equities and real estate. Without those assets, household wealth barely grew in real terms. The Federal Reserve’s September 11, 2026, Financial Accounts release adds another year of data, through 2026:Q2. This month we revisit the analysis to see what changed in that year.
Since 2022:Q4 (roughly the start of the AI era), household wealth has risen by $52.8T in nominal terms. Net worth reached $195.9T, and the ratio of net worth to disposable income hit a record 8.28, above its 2022:Q1 peak. 2026:Q2 brought the largest quarterly wealth increase on record, $12.8T, of which $10.7T came from corporate equities. It followed a soft 2026:Q1, when equities lost $1.2T and the modest overall gain came from real estate and other assets.
The divide we described last year has widened. Since 2019:Q4, net worth is up $81T in nominal terms and $48T in inflation-adjusted terms (2026:Q2 dollars; Figure 1). Excluding equities, the real gain drops to $16T. Excluding equities, debt securities and real estate, it is only $3T. Since 2022:Q4, real net worth has risen by $37T, while the ex-equity measure has added $6T and the ex-equity/debt/real estate measure just $1T. Over the past year, equities accounted for about 90% of the $15T real gain. Households that did not own equities or real estate have largely missed the wealth expansion of this decade. Real estate benefited from the pandemic, the renewed priority households placed on homeownership, and ultra-low interest rates. Once inflation and a sharp economic rebound pushed rates higher, around the time ChatGPT launched at the end of 2022, nearly all subsequent wealth creation went to equity holders.
Figure 2 and Table 1 break the change in assets into more granular components, and the category definitions are important for reading the trends. Direct investments are stocks, bonds and ETFs held in taxable brokerage accounts, closely held corporate equity (private C- and S-corporations) and founder and insider stakes in public companies. Indirect investments are defined-contribution plans (401(k), 403(b), etc.), mutual funds held by households, and life insurance and annuity products. Self-directed IRAs are split: stocks, ETFs and bonds count as direct investments, while mutual funds and annuities count as indirect investments. The sum of indirect holdings and defined benefit (DB) entitlements serves as a proxy for the retirement safety net.
Directly held stocks and bonds are now $28T above their 2019:Q4 level in real terms, and $11T of that increase came in the past four quarters. Indirect holdings plus DB entitlements have only just returned to their 2019:Q4 real level. Business ownership (proprietors’ equity in noncorporate business), our proxy for small-business net worth, is still 6% below its 2022:Q4 level in real terms. The decline has stopped, and the value is up about 1% over the past year, but there is no recovery yet. Since 2022:Q4, most of the gains in asset values have come from direct investments, mostly equities. Indirect investments also gained, but those gains barely offset the losses in the pension safety net. Combined with DB entitlements, they are only 1% above their 2019:Q4 level in real terms.
Figure 1: Change in US Household Real Net Worth from 2019:Q4 ($T in 2026:Q2 Dollars)
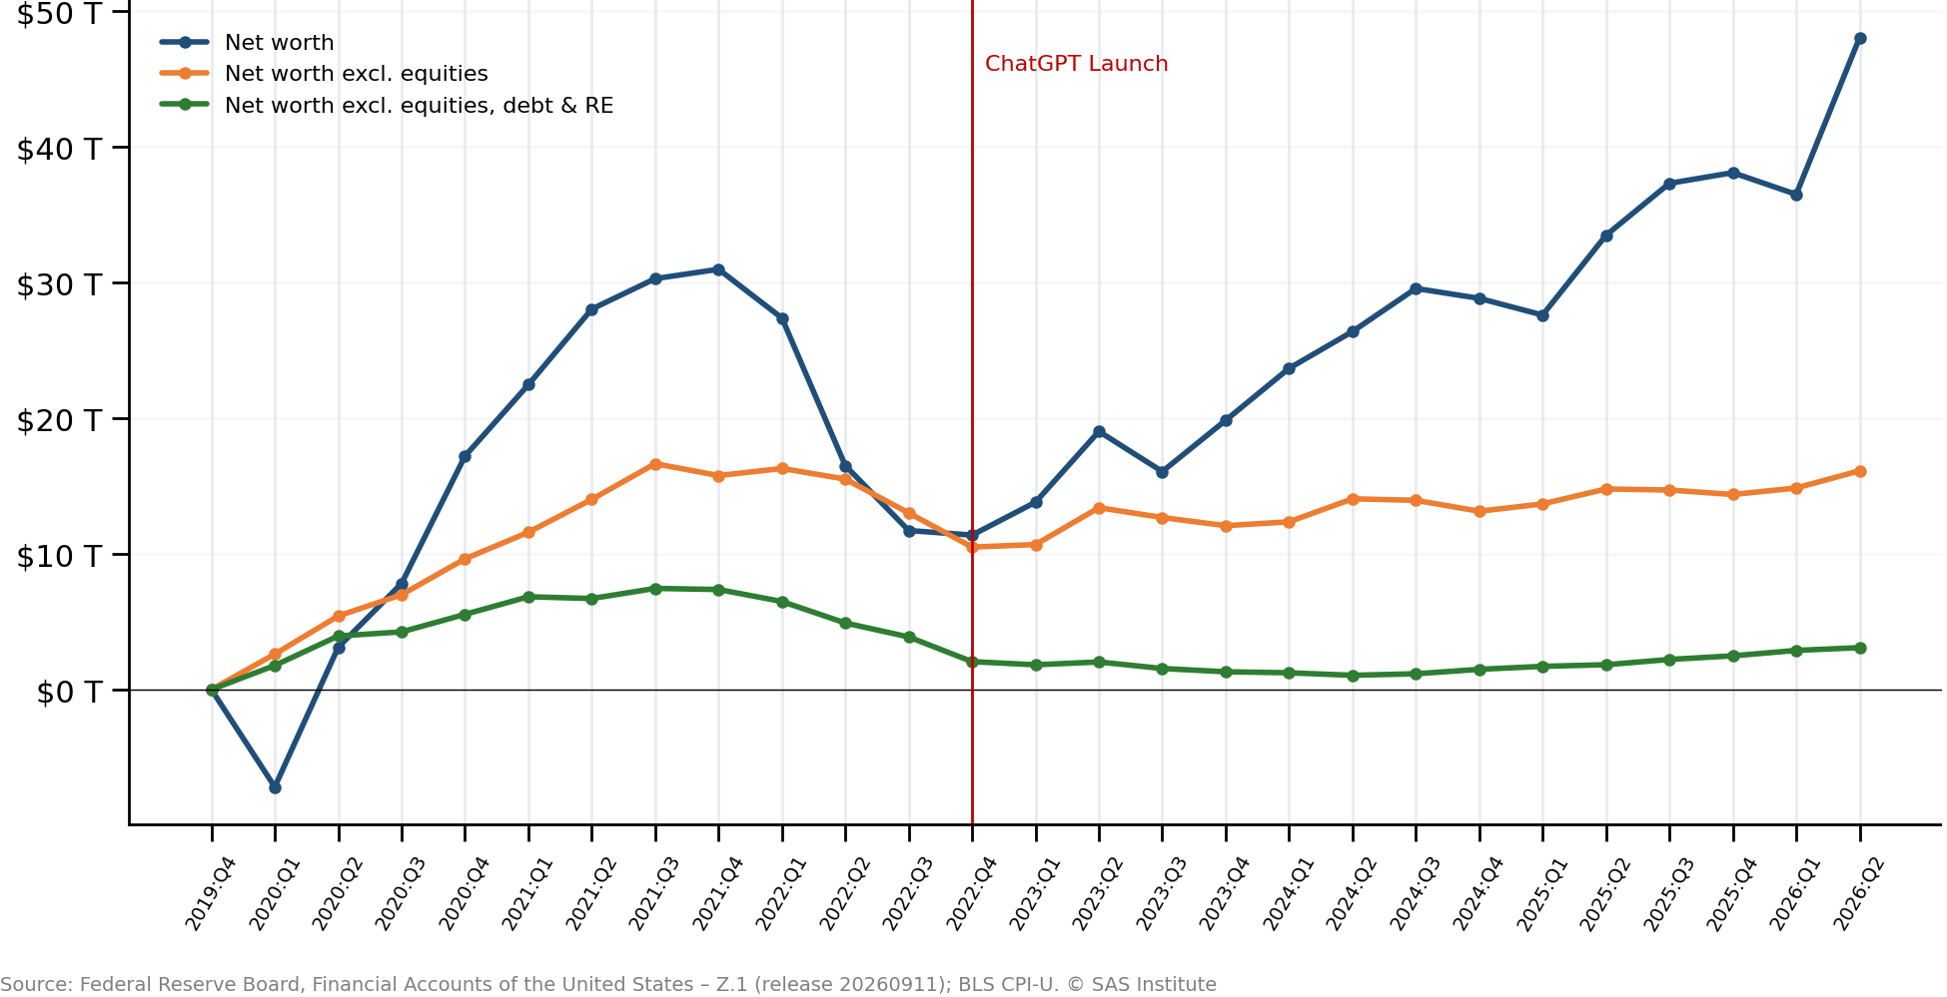
Figure 2: Change in US Household Real Assets from 2019:Q4 ($T in 2026:Q2 Dollars)
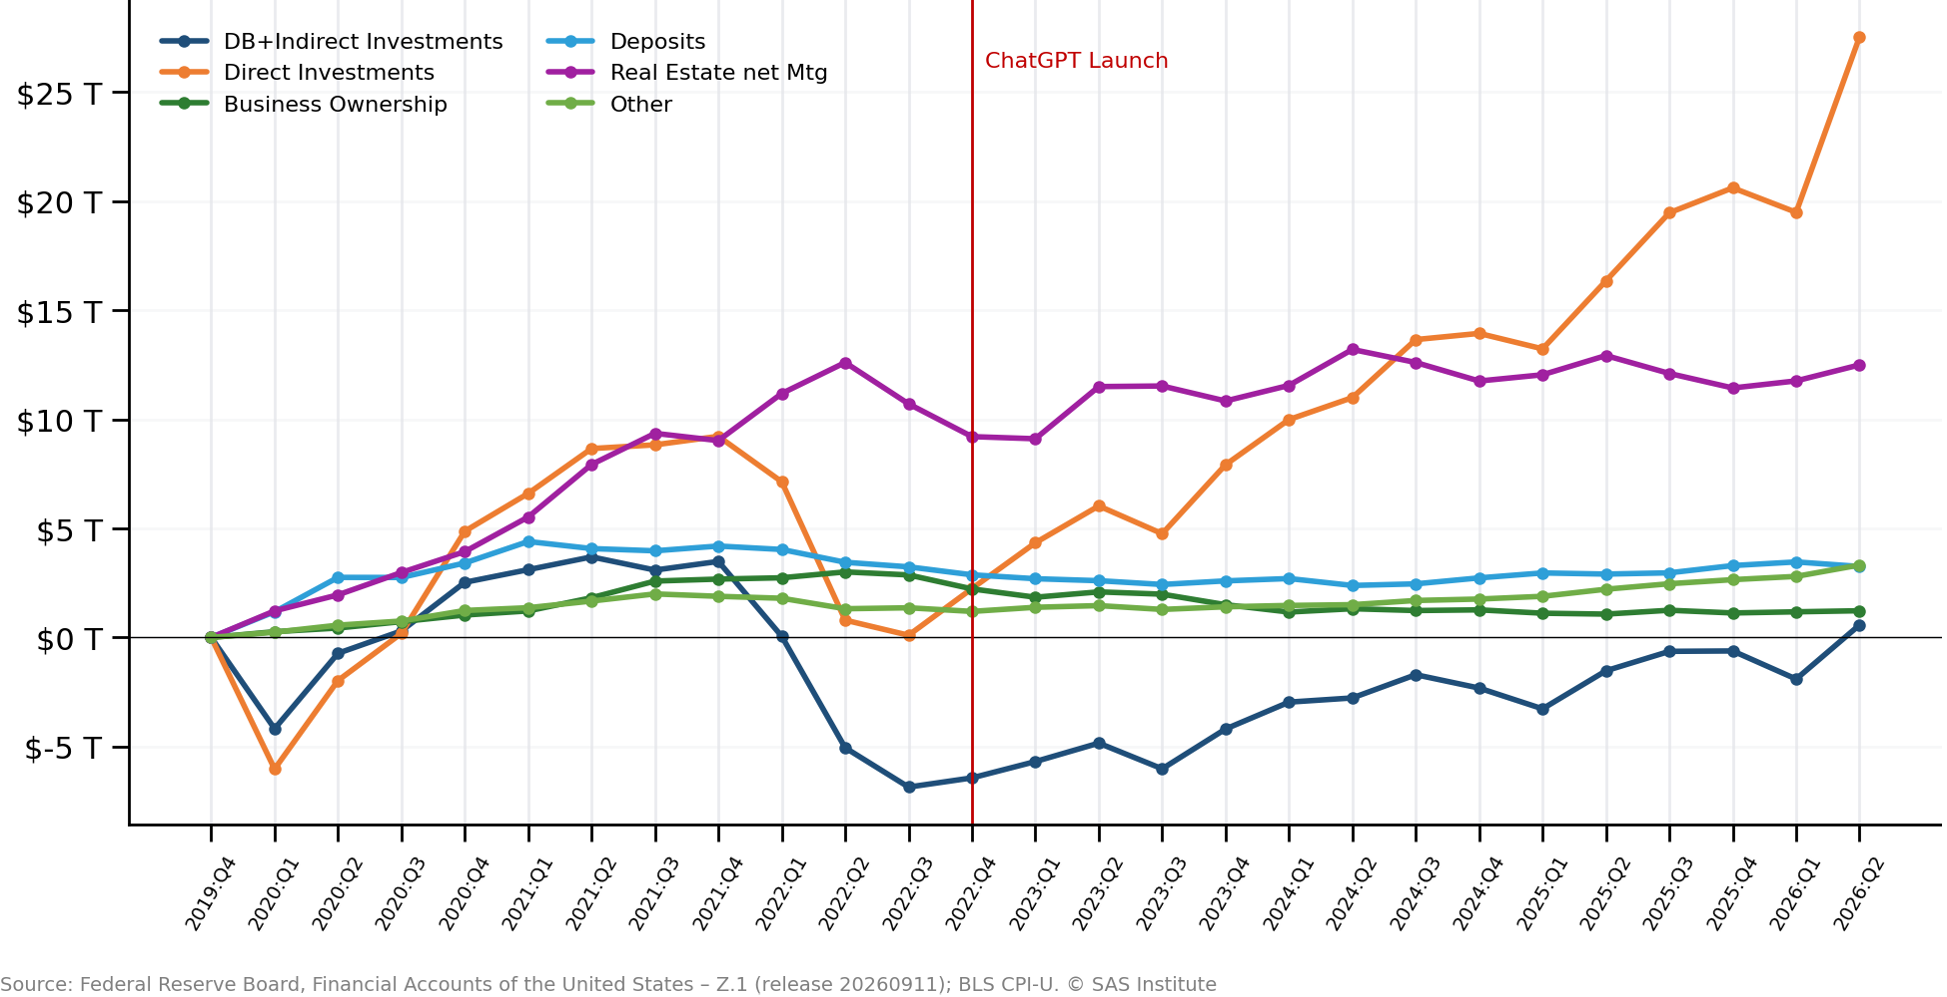
Table 1: Change in US Household Real Assets Net of Mortgage Debt

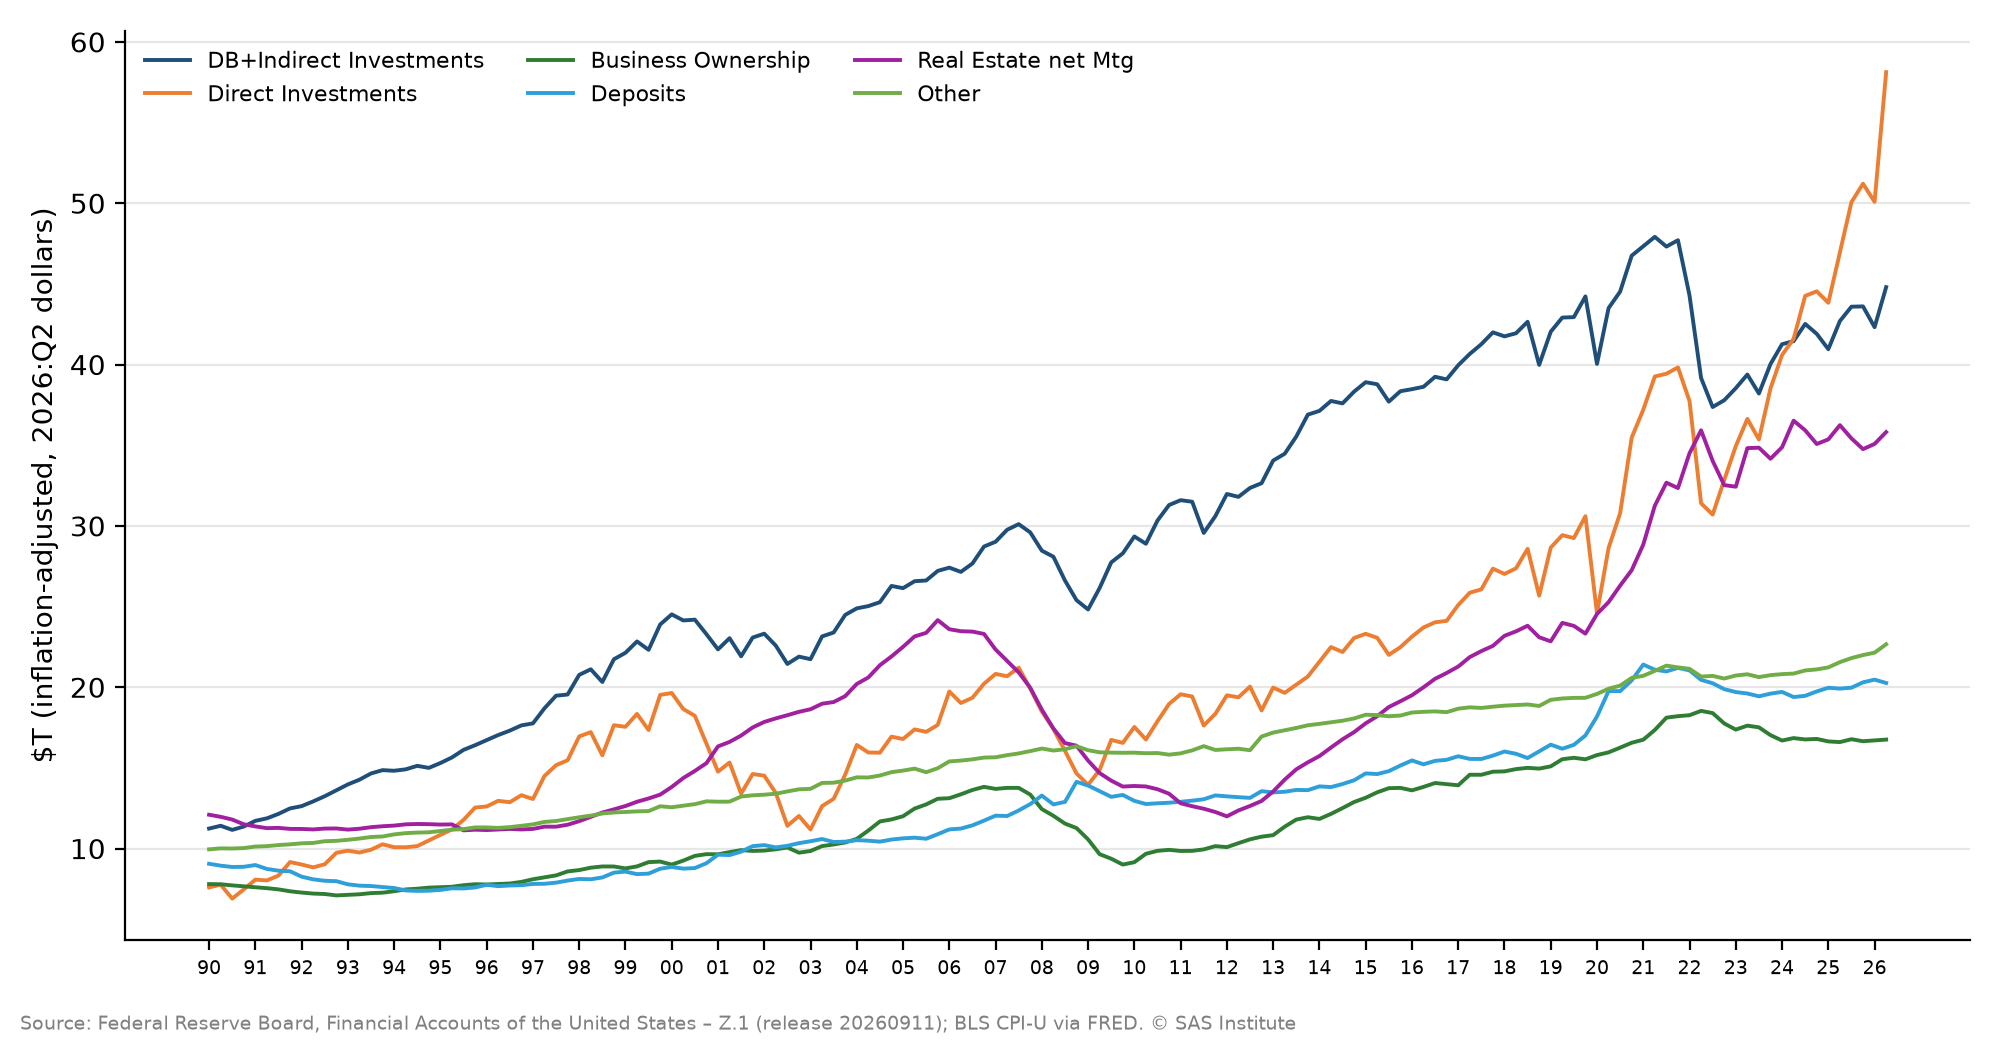
Figure 3: Total US Household Real Assets Net of Mortgage Debt ($T in 2026:Q2 Dollars)
Compared with the trends we noted last year, here is what has continued and what is new:
- Continued, and stronger: concentration in equities. Direct investments are up 77% in real terms since 2022:Q4, while total assets net of mortgages are up 23%. Directly held stocks and bonds account for more than two-thirds of that real increase.
- Continued: small business is lagging. Business ownership is still 6% below its 2022:Q4 real level. It has stabilized but not recovered.
- New: housing wealth has stalled. Real estate net of mortgages is down 1% in real terms over the past year. It is no longer a second source of wealth growth for households without significant equity holdings.
- New: retirement assets have recovered. DB entitlements and indirect investments are up 19% since 2022:Q4 and are now slightly above their 2019:Q4 level. This spreads part of the equity gain to retirement savers.
The overall picture is largely the same as last year, only further exacerbated. Aggregate household wealth is at a record, but the gains come from equity values and are concentrated among direct owners. Housing equity and small-business net worth are flat or falling in real terms.
Why does this matter for corporate credit?
Consumer credit is usually analyzed separately from the AI theme. The Z.1 data suggest that separation may no longer hold. The wealthiest households own most directly held equity, and much of that equity is in AI-linked names. The same households now account for a record share of consumer spending. A correction in AI stocks would therefore hit consumer-facing credits through reduced spending by the top income and wealth groups, while also widening spreads for AI issuers directly. Portfolios that hold both AI exposure and high-income consumer exposure may be less diversified than they look.
Data notes
- All Z.1 series come from a single release (Federal Reserve Board, Financial Accounts of the United States – Z.1, September 11, 2026, 2026:Q2 data). The full history for 1952–2026 was re-pulled, so comparisons with the November issue include the Fed’s benchmark revisions.
- All series are deflated in levels with CPI-U (seasonally adjusted) and expressed in 2026:Q2 dollars; changes are measured as the difference between real levels.
AI Credit Risk Dashboard Update
Credit risk across the AI infrastructure ecosystem continued to rise after the October 16 update, although the pace of deterioration slowed in the latest week. The pressure is still concentrated in specific financing-dependent segments rather than spread across the investment chain.
Between October 16 and October 30, the category-balanced AI Credit Pulse Index rose from 65 to 75 basis points, while the Company Average rose from 28 to 31 basis points. The index gives equal weight to each of the 15 economic categories, so a sharp move in a small, high-risk category moves the index more than the equal-weighted average of the 162 covered companies.
The deterioration remained concentrated in the areas highlighted in the prior update. The average one-year PD of specialist AI cloud and GPU service providers increased from 98 to 118 basis points. AI hosting and powered campuses rose from 184 to 212 basis points. Fiber and digital transport increased from 553 to 658 basis points and remains by far the highest-risk category. These three moves explain why the index increased more than the Company Average.
The dashboard still shows growing pressure among specialist cloud providers, powered campuses and selected connectivity issuers, but not a broad deterioration across the AI ecosystem. The central question is now timing: whether debt-funded capacity can become operational and generate cash before higher financing costs, infrastructure bottlenecks and refinancing needs erode borrowers’ room for error.
Table 2: AI Credit Risk Dashboard (KRIS 1Yr PD in basis points)
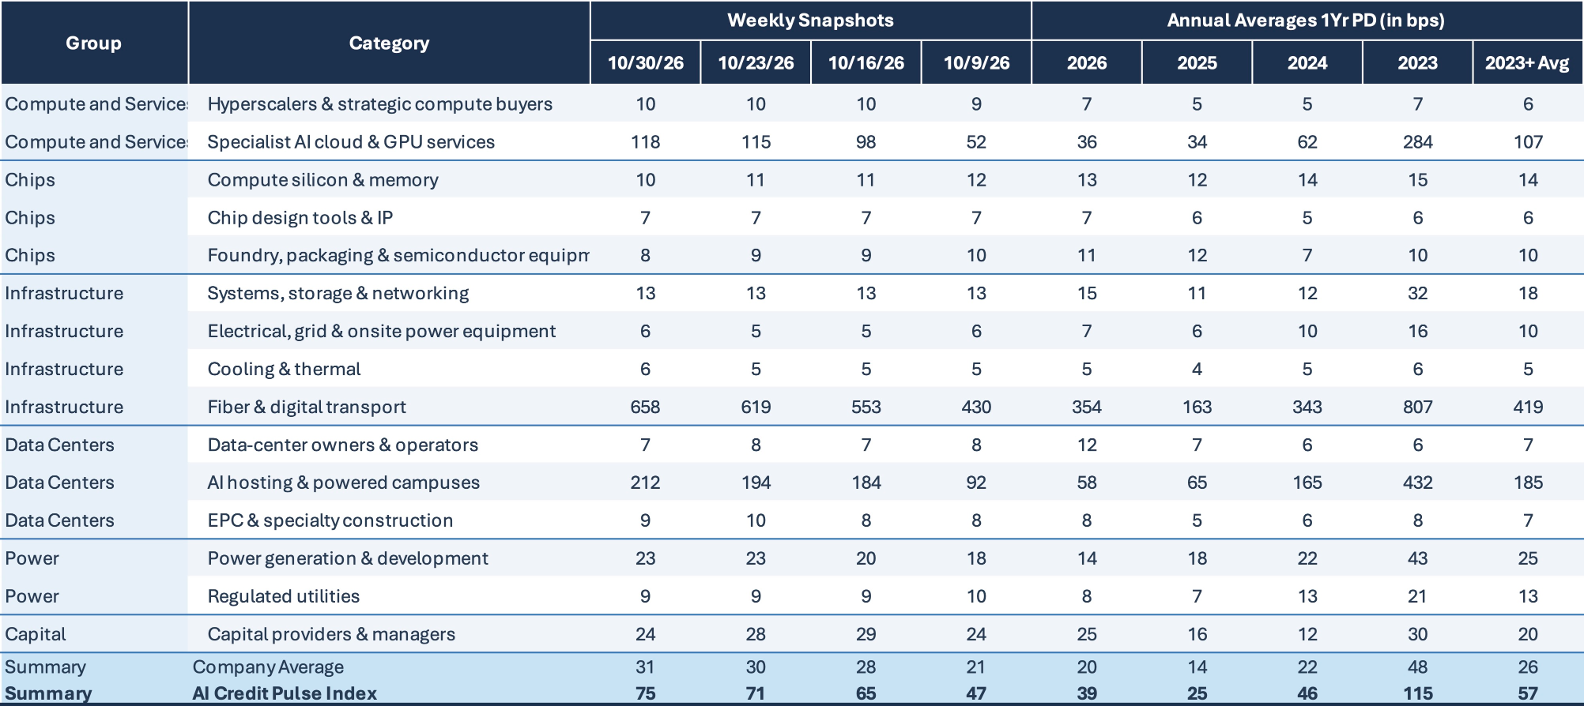
Figure 4: AI Credit Pulse Index
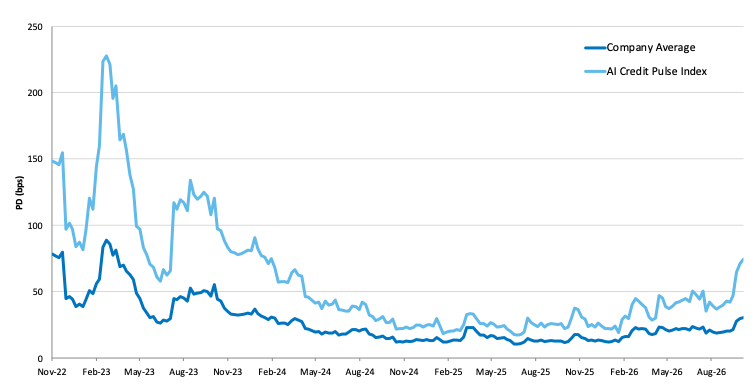
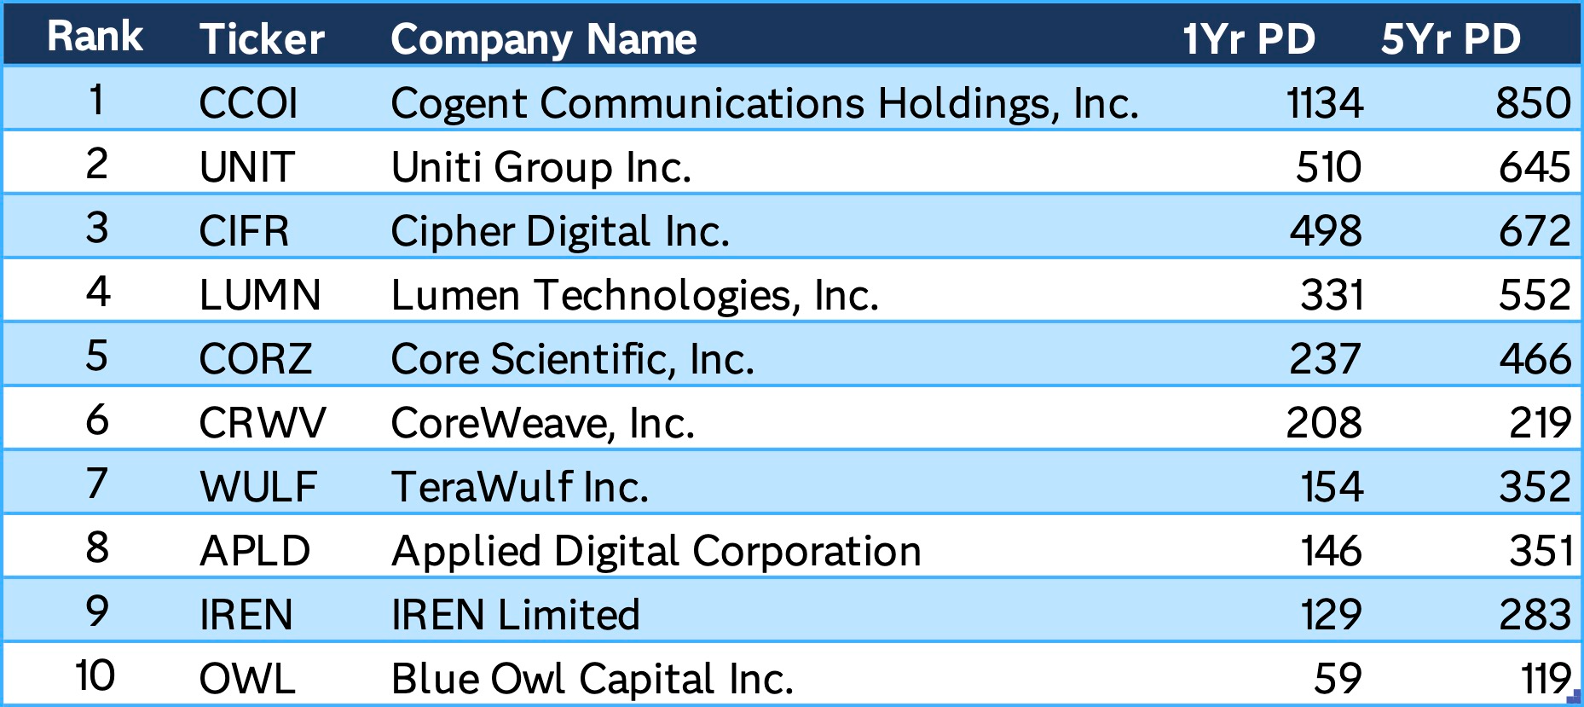
Table 3: Top 10 AI companies by 1 year PD
Credit Conditions Summary – Top 3000 US Firms
October results show a clear gap between the largest companies and the broader corporate universe. Cap-weighted credit conditions remain relatively benign. The overall 1-year PD is 10.5 bps, 4.0 bps below its historical average and at the 39th percentile. Energy, Financials, and Communication Services are particularly low relative to their histories.
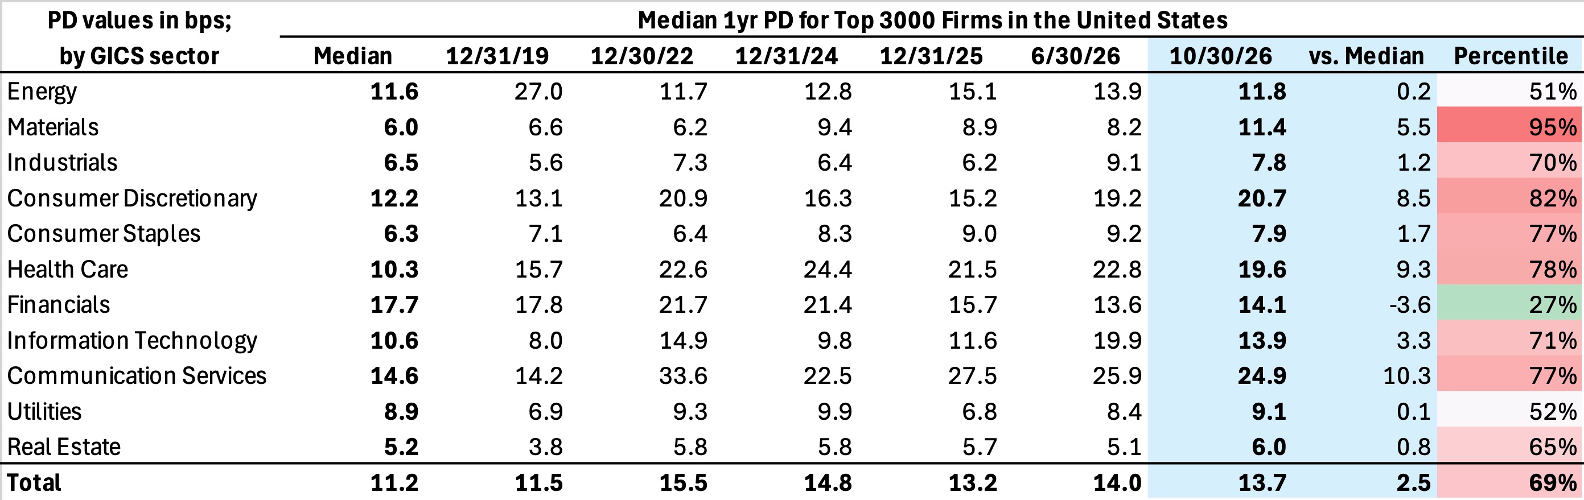
The equal-weighted median is 13.7 bps, 2.5 bps above its historical median and at the 69th percentile, pointing to greater stress among the typical company. The pressure is concentrated in a few sectors. Materials are at the 95th percentile, Consumer Discretionary at the 82nd, Health Care at the 78th, and Communication Services at the 77th.
Figure 5: Market Cap-Weighted Cumulative Default Probability – Top 3000 Companies in the US
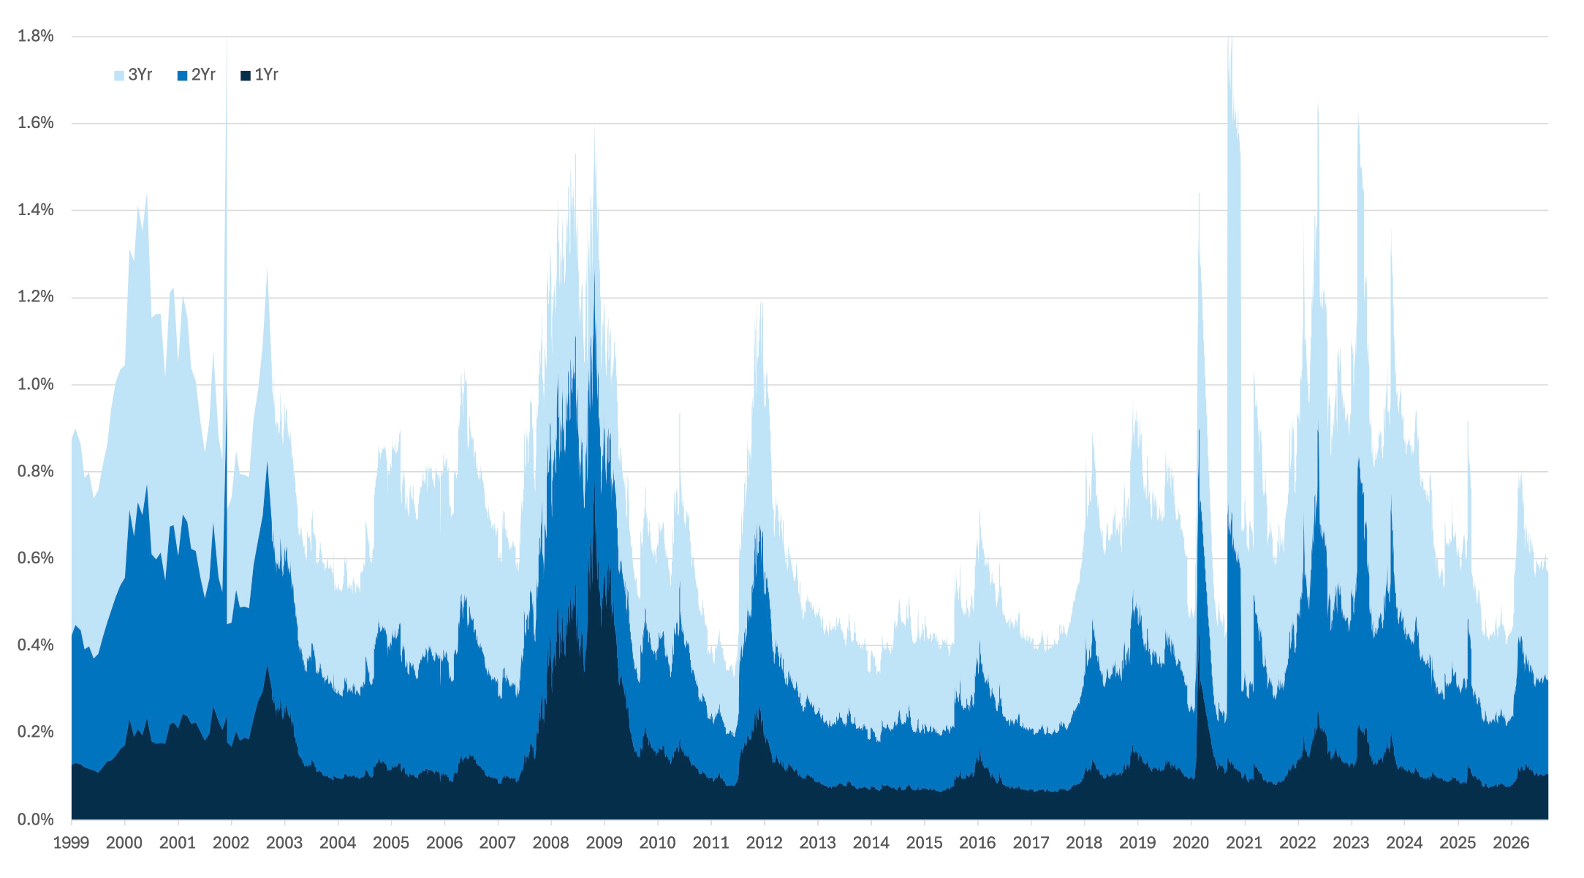
Figure 6: Median Cumulative Default Probability – Top 3000 Companies in the United States
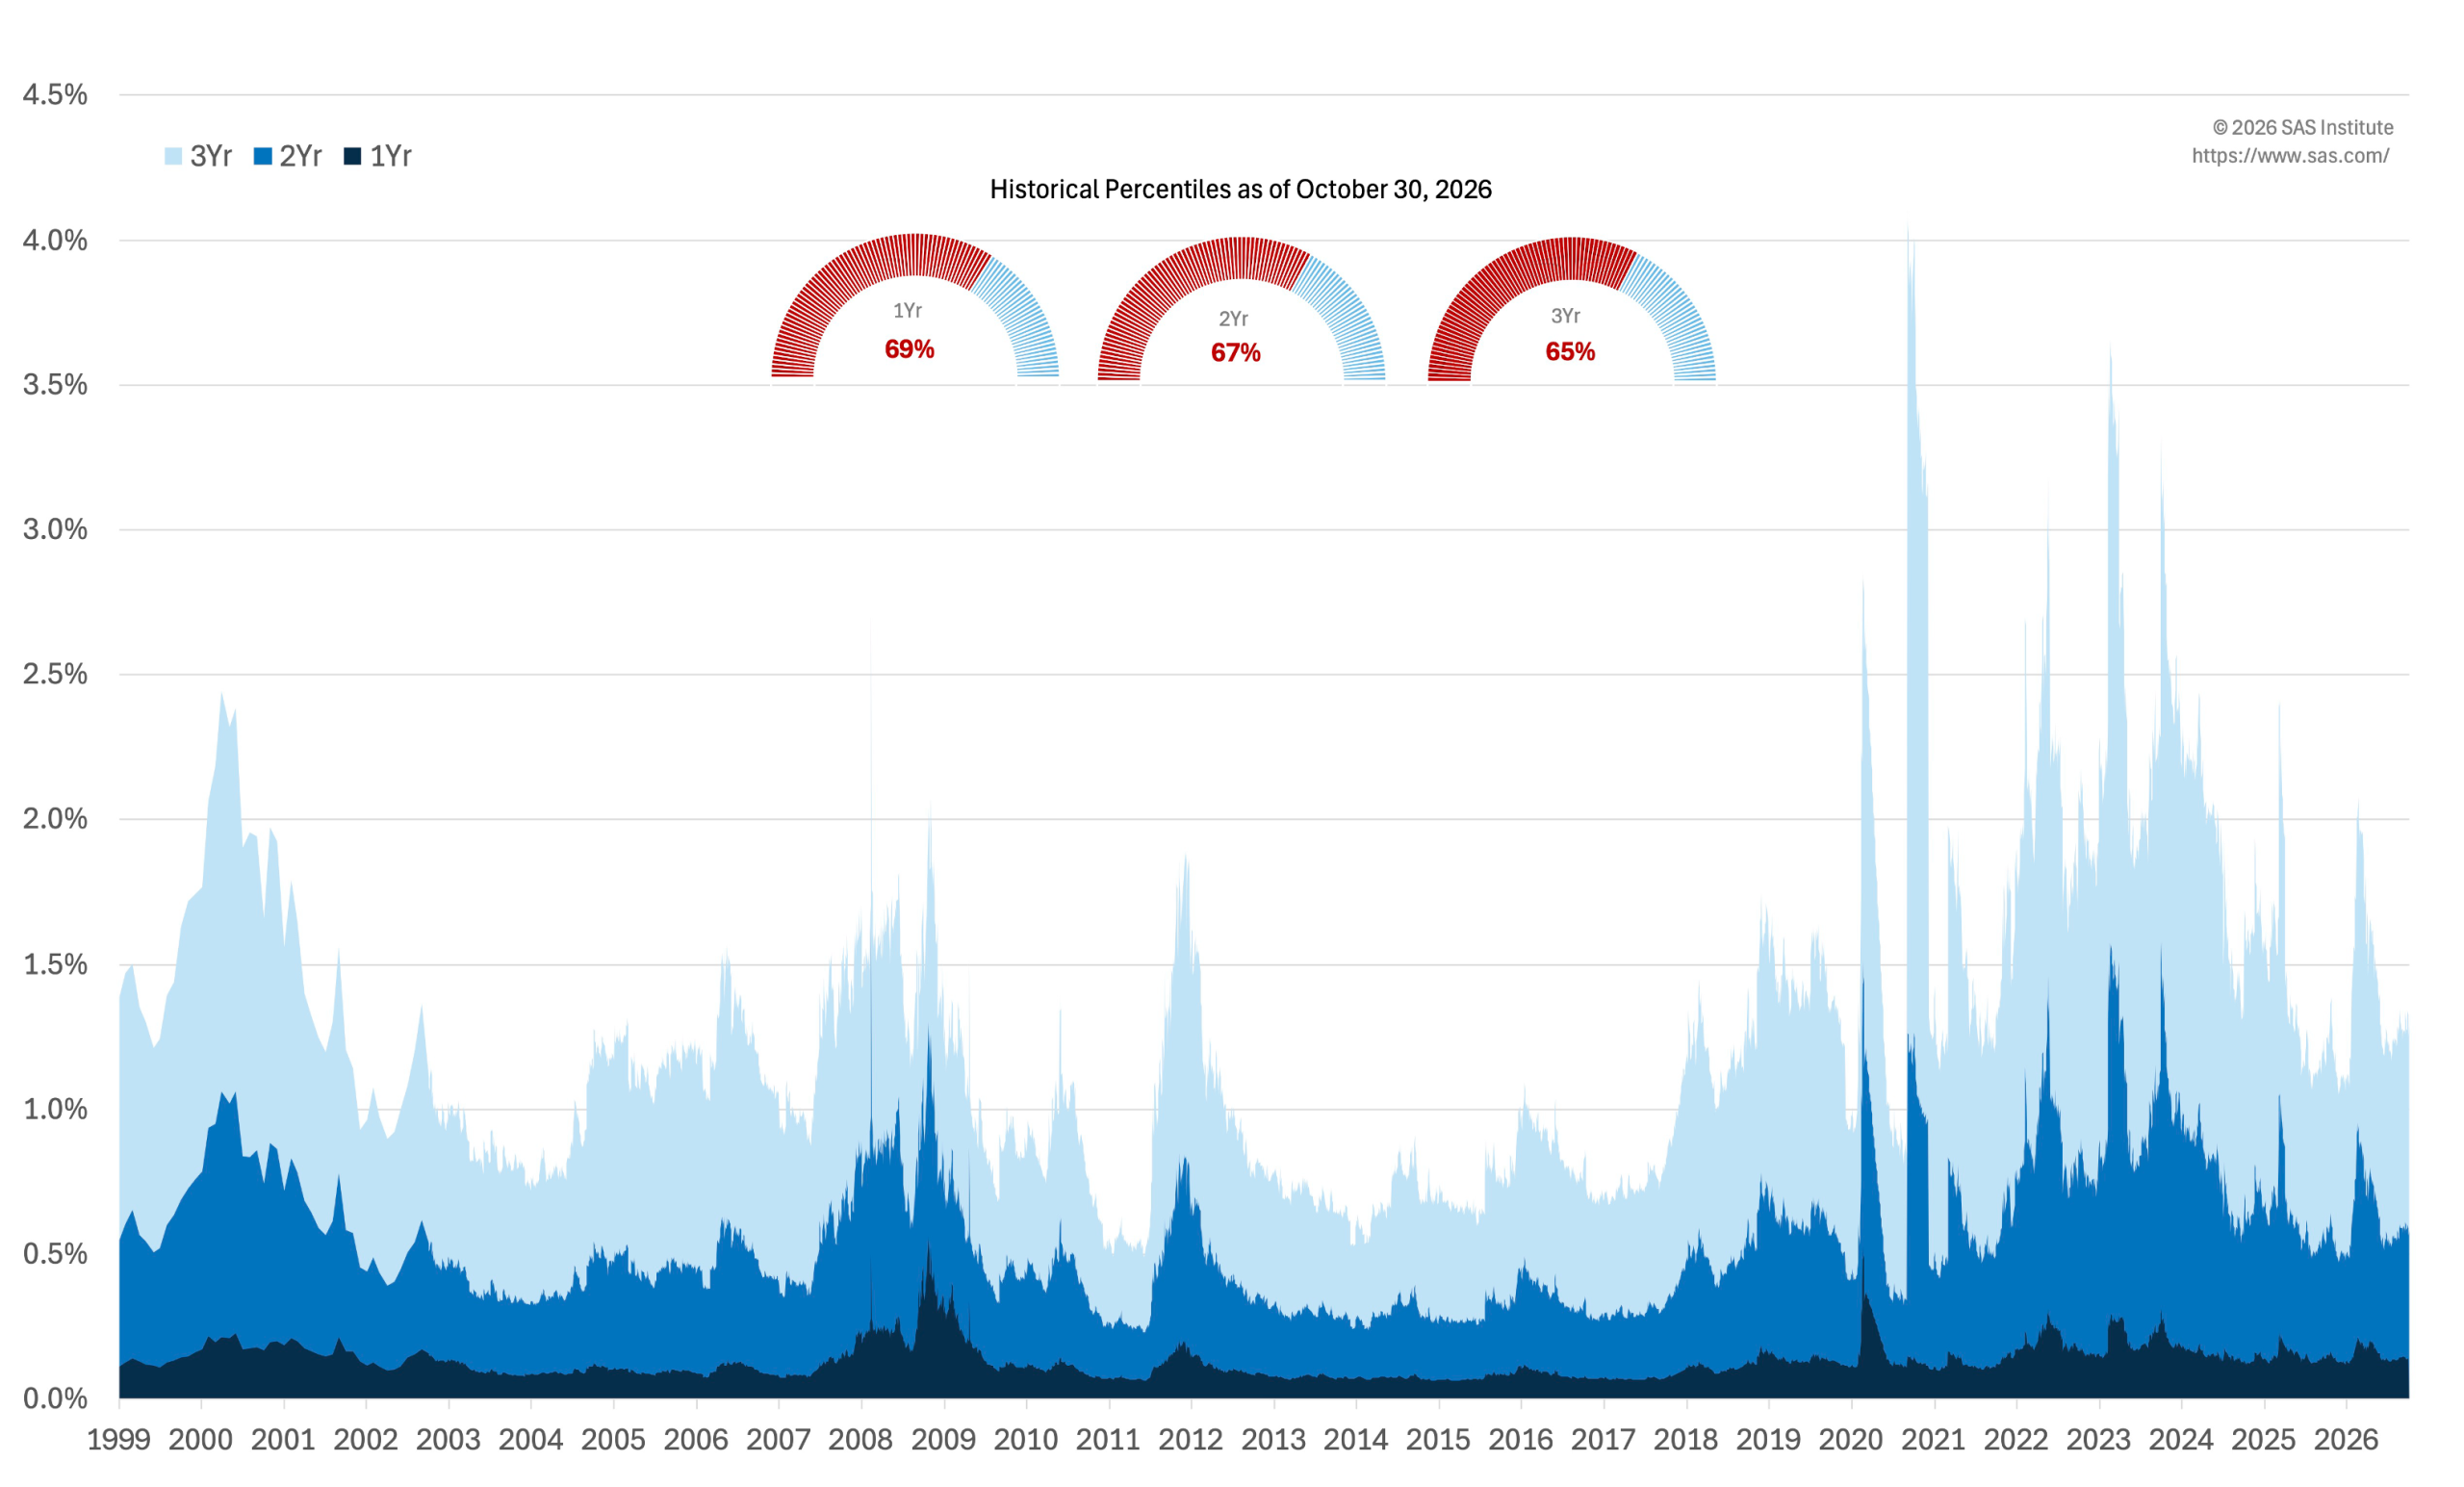
Table 4: Market Cap-Weighted Average 1-year Default Probability (Top 3000 Firms in the United States)
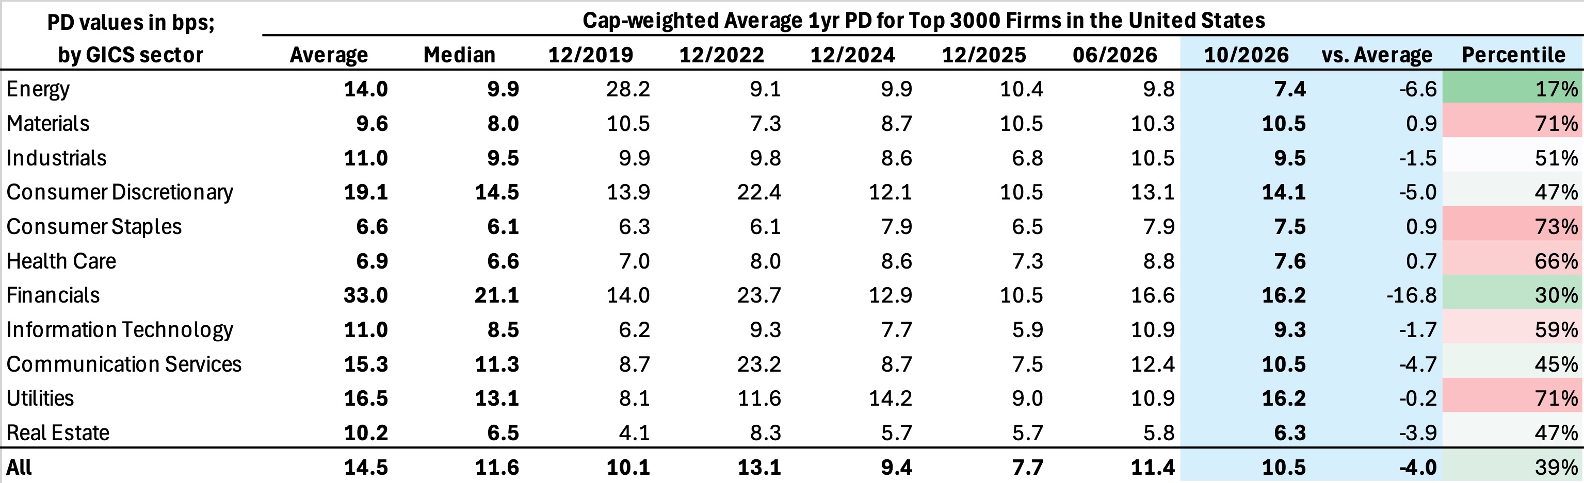
Table 5: Median 1-year Default Probability (Top 3000 Firms in the United States)
Why KRIS PD forecasts matter now. Market prices can remain calm even as underlying risk becomes more concentrated, making model‑based, issuer‑level signals increasingly important. KRIS default probabilities provide daily, issuer‑level signals that help make this bifurcation visible: pinpointing names where refinancing pressure, equity‑volatility shocks, or weakening coverage metrics are emerging even when credit spreads do not move. Used alongside market spreads and fundamental analysis, PDs help identify risks that are not yet fully priced, providing actionable early‑warning signals.
Appendix
Table 6: Riskiest Rated Companies Based on 1-year PD
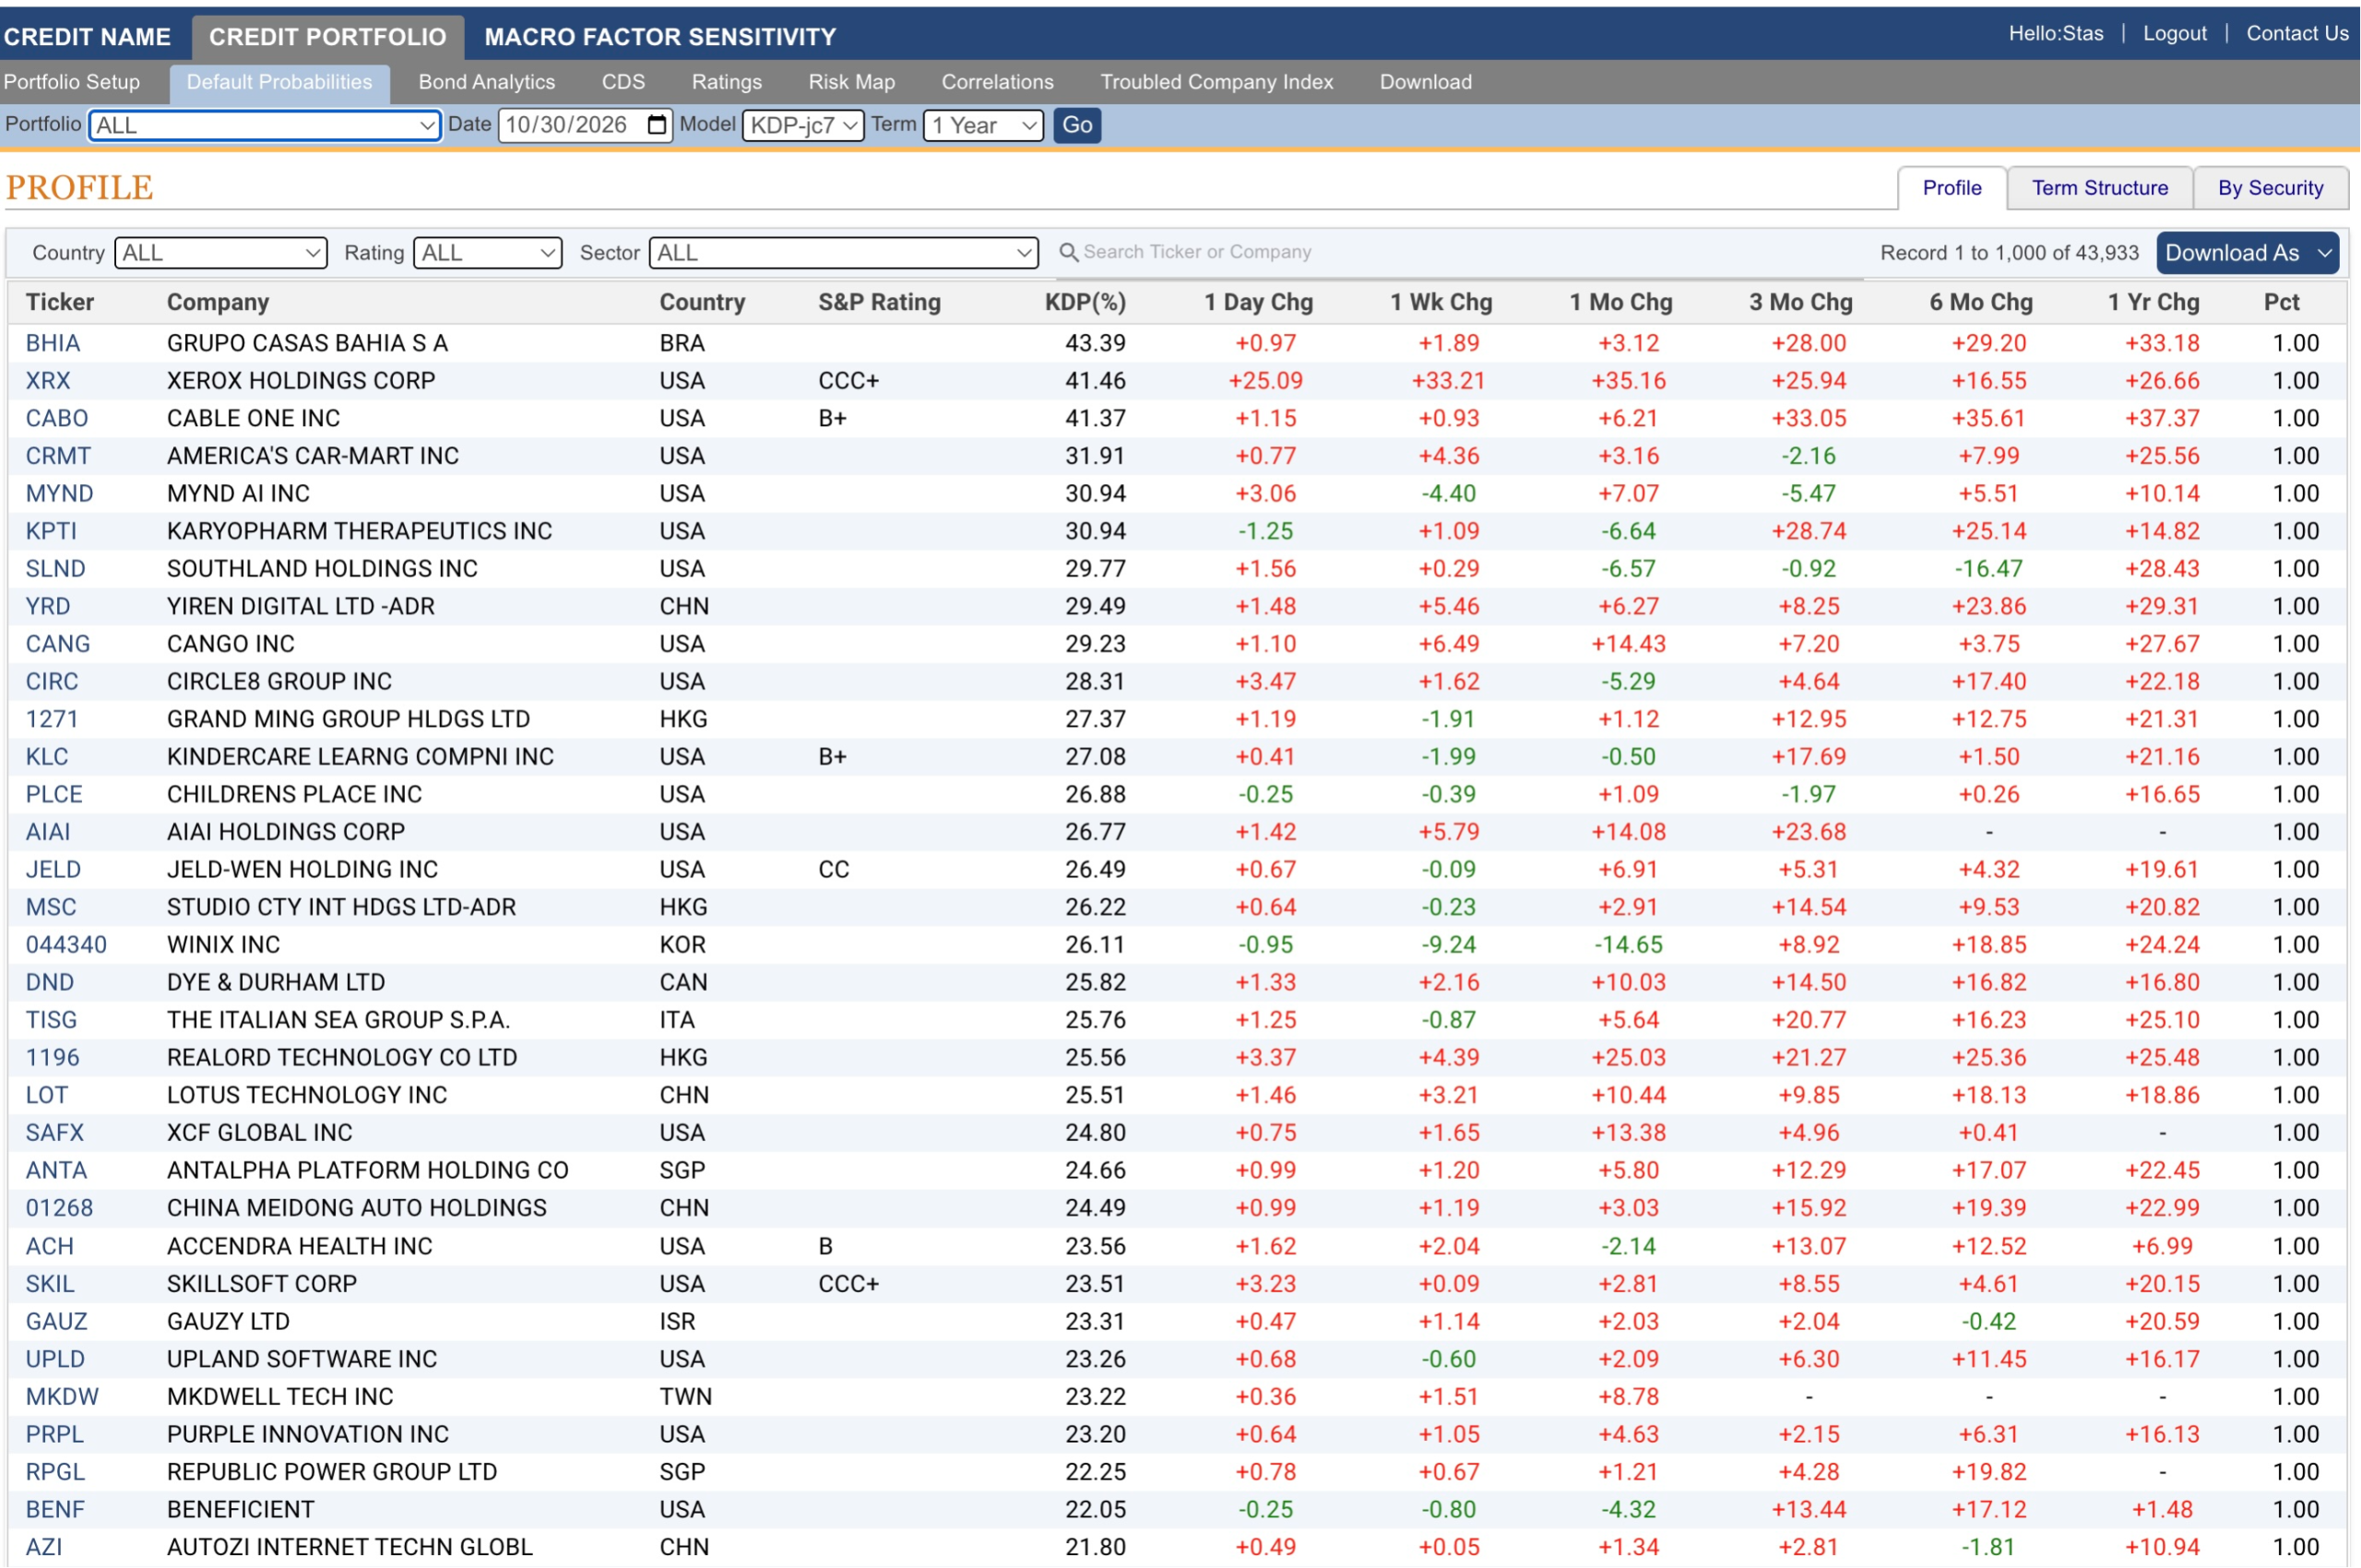
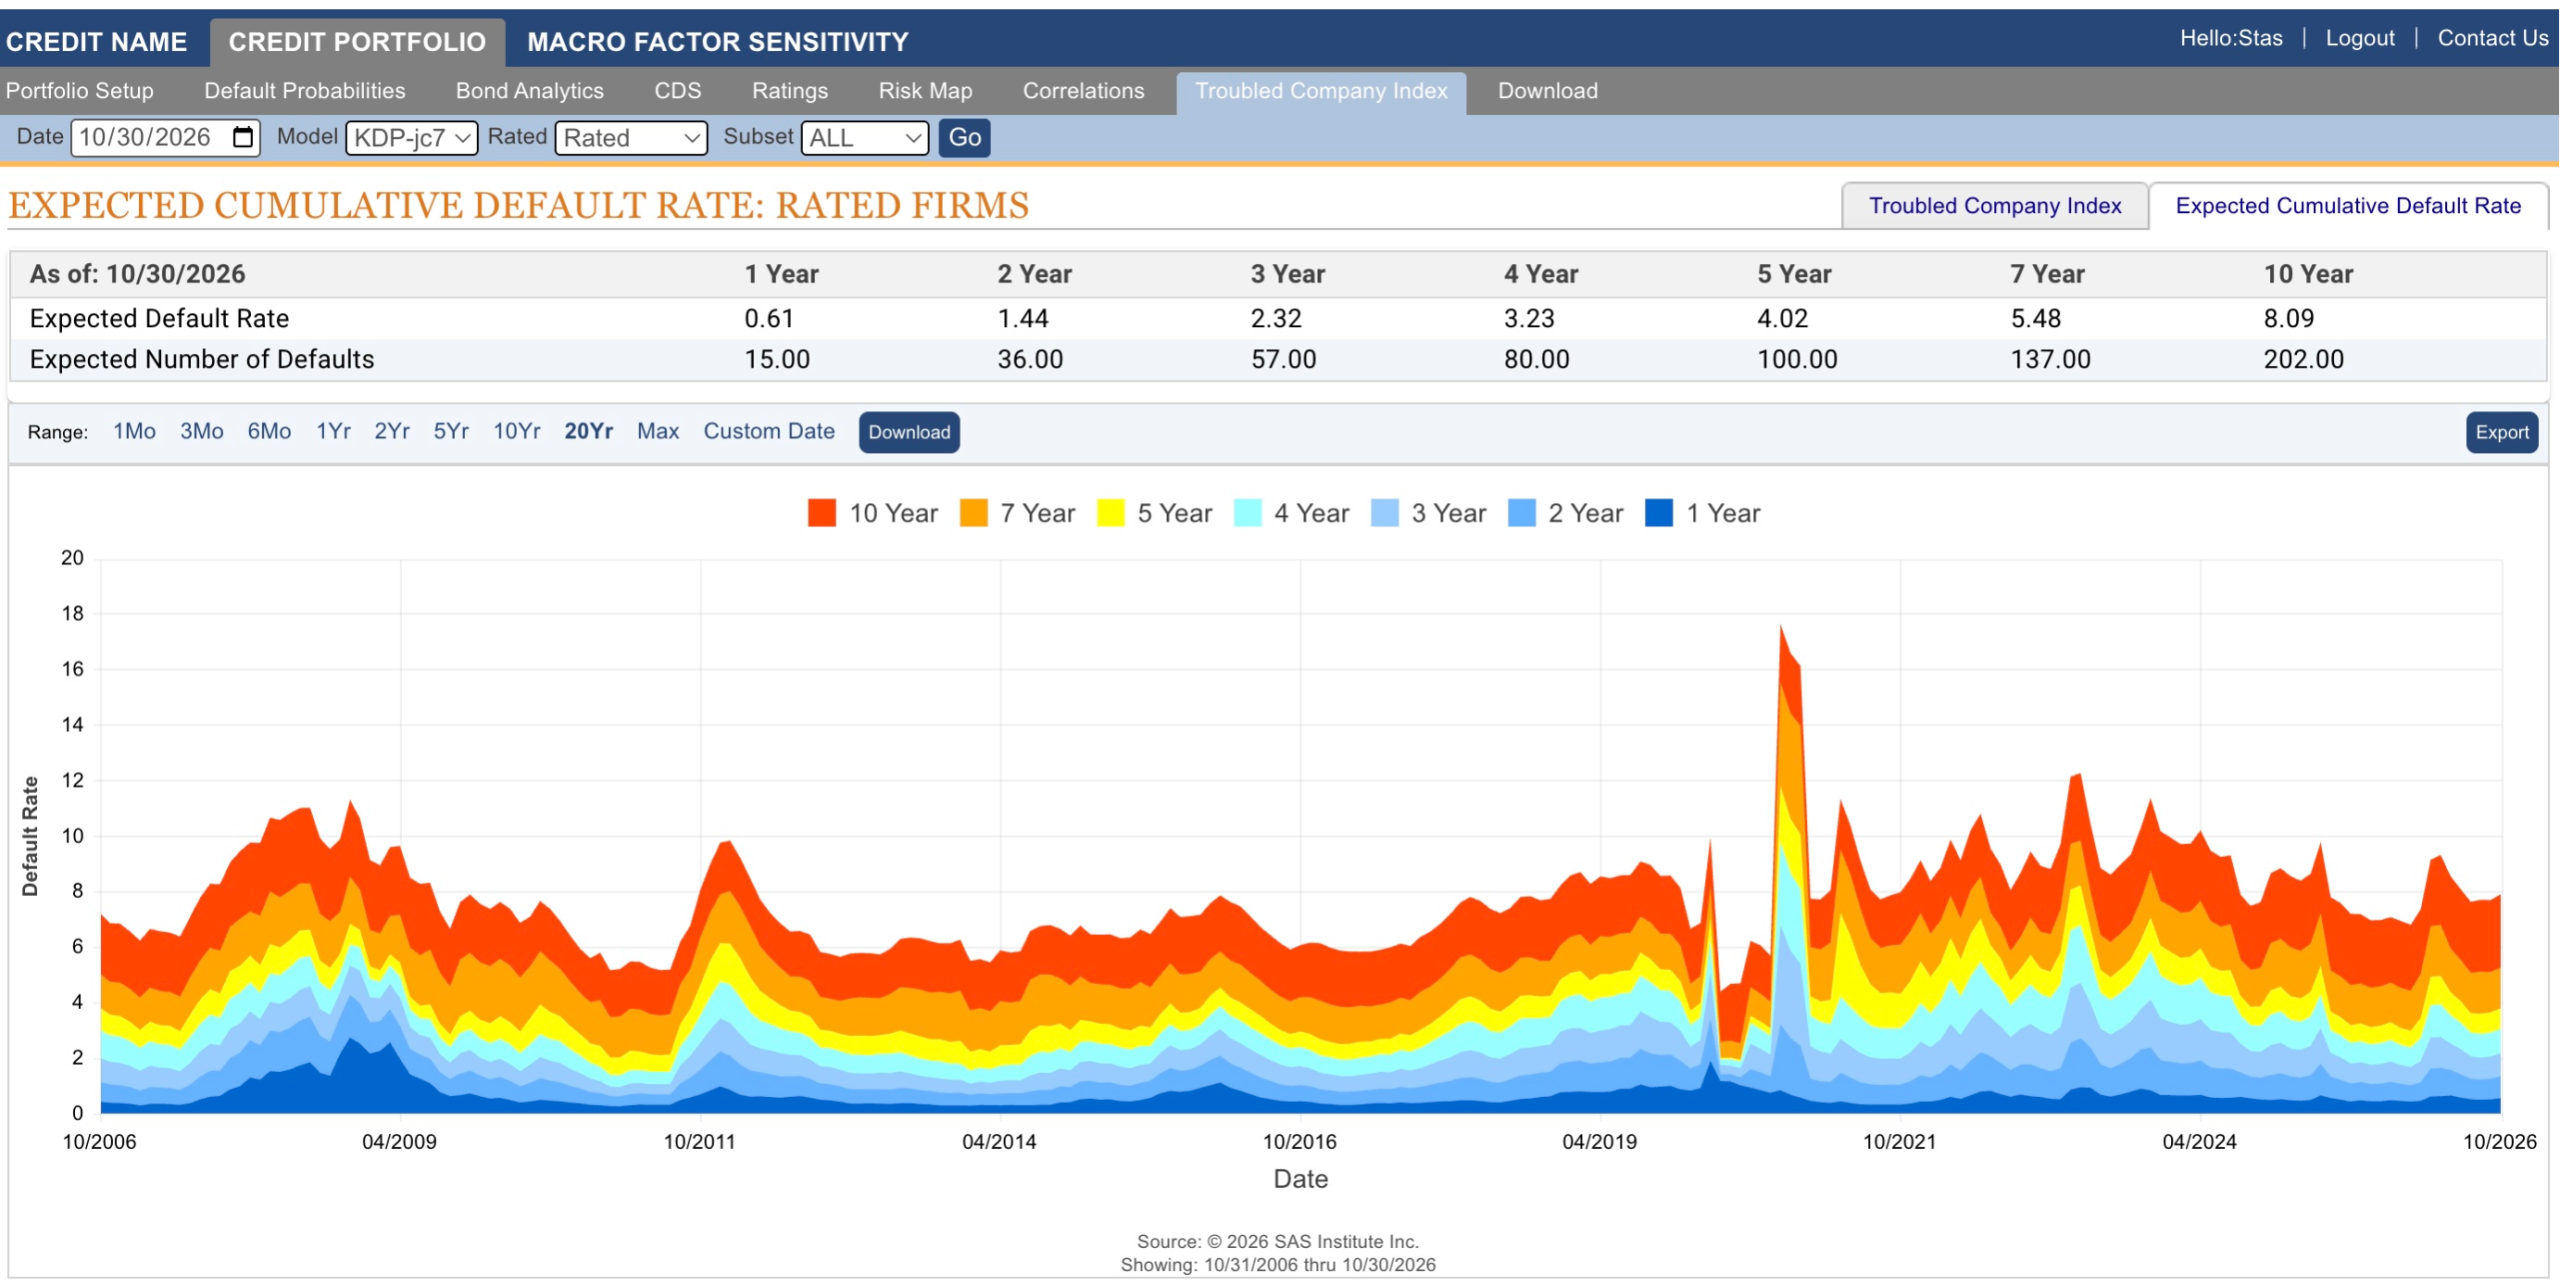
Figure 7: Expected Cumulative Default Rates
About SAS
SAS is the leader in analytics. Through innovative software and services, SAS empowers and inspires customers around the world to transform data into intelligence. SAS gives you THE POWER TO KNOW®.
Editorial contact: Stas Melnikov – stas.melnikov@sas.com