

NEW YORK October 1, 2025: The U.S. markets have become conditioned to seeing the Federal Reserve step in whenever negative conditions appear to worsen. Of course, many see the Fed’s interventions as a safety net – as indeed they are during times of crisis. But cumulatively, outsized government interventions can create a dangerous combination of moral hazard, distorted credit cycles, and hidden risks of long-term default. This is where we are today.
How did we get here? And what can we do to obtain the realistic valuations we need to protect our assets? These are some of the questions this month’s commentary will address.
Our story begins with the 2007-2009 Global Financial Crisis (GFC), when the Fed was forced to take non-standard and unconventional actions. By unconventional actions, I am referring to measures beyond adjusting the fed funds rate. These extraordinary actions included large-scale asset purchases (Quantitative Easing, or QE), special lending facilities, expanded forward guidance, and significant balance sheet interventions.
The GFC was different from other modern economic crises because it originated in the financial system itself – specifically, in the U.S. housing finance and mortgage-backed securities. Excessive leverage, securitization, and complex derivatives were sold globally, largely based on complex models and favorable ratings. In other words, this was a credit-driven crisis.
Most other market stress events of the recent past were triggered by inflation shocks, commodity price spikes or declines, geopolitical events or sovereign debt defaults. But the Lehman Brothers default and the fragility of large global banks created a systemic freeze in counterparty trust – the basic tenet of functioning financial markets. The nature of the crisis and the speed of contagion forced central banks to move quickly and use unconventional measures to stabilize global markets.
To refresh your memory, I will outline the actions taken by the Fed in response to the GFC and its immediate aftermath:
- August 2007 – first liquidity action – Term Auction Fund (TAF) to provide banks with secured funding.
- December 2007 – introduction of liquidity swap lines with foreign central banks to ease global dollar funding stress.
- March 2008 – Primary Dealer Credit Facility (PDCF) and Term Securities Lending Facility (TSLF) introduced after the failure of Bear Stearns.
- September 2008 (following the collapse of Lehman Brothers) –
- Creation of Commercial Paper Funding Facility (CPFF).
- Creation of Asset-Backed Commercial paper Money Market Mutual Fund Liquidity Facility (AMLF).
- November 2008 – QE 1 announced with purchase of $600 billion in agency MBS and GSE debt.
- December 2008 – Fed cuts rates to near zero (0-0.25%) and begins forward guidance, saying rates will remain “low for some time.”
- March 2009 – QE 1 expanded to $1.75 trillion and included MBS, agency debt and Treasuries.
- November 2010 – QE 2 announced, with another $600 billion in Treasury purchases
- September 2012 – QE 3 announce. Compared to QE1 and 2 it was open-ended at first, with no preset size or end date—showing the Fed was willing to act without limits.
This is quite a list – one for the history books. During the GFC, the Federal Reserve increased its balance sheet by about $3.5 trillion to $4.5 trillion, or about 25% of GDP at that time. Most of the growth came from asset purchases as part of Quantitative Easing. These actions, initiated in response to the deepening of the crisis, changed the toolkit traditionally used by the Fed and changed the way markets operate.
The Fed’s widescale actions became increasingly difficult to unwind. For example, the market reacted with what became known as the “taper tantrum” in 2013, after the Fed signaled a slowing of QE. Not a stop, just a slowdown. During the 2013-2019 time period, the Fed took various steps to achieve the goal of balance sheet normalization. But each time, The Fed continued to respond to market disruptions with further use of its balance sheet. The repo market price spikes in 2019 were one example; then, of course, the Covid-19 crisis hit in 2020, stimulating yet another set of emergency actions and facilities.
Fiscal and monetary policy in response to Covid contributed to the inflationary conditions of 2021-2022. Ultra-low rates drove investors to search for yield in riskier and longer-term assets. That, in turn, compressed spreads, making it harder to price risk accurately. Demand for high-yield debt, leveraged loans, and private credit and equity increased, while zombie firms survived longer than they should have, further disrupting the credit cycle.
QE and extended near-zero rates also boosted stock, bond, and housing prices. Wealth inequality relative to wage earners and renters increased as asset holders gained more, exacerbating strains in the social structures required for a functioning representative democracy. The economic environment also encouraged corporations to favor share buybacks over real investment, and shifted longer-term demand from sovereign debt to higher-yielding corporate debt.
The low rates also squeezed net interest margins at banks setting the stage for a Silicon Valley and regional bank crisis as banks invested long but seemed to forget how to manage duration risk.
Through its actions, the Fed’s balance sheet ballooned from under $1 trillion prior to the GFC to over $8 trillion post-Covid. This gargantuan expansion made it extremely disruptive for the Fed to unwind its programs without negative effects, creating the moral hazard situation we see today, where market participants walk a tightrope expecting the Fed to rush in with a safety net if it starts to sway in the wind.
Given that every attempt to normalize has resulted in increased volatility, the Fed’s unconventional tools have likely become semi-permanent. They have distorted historical models and traditional signals like the inverted yield curve. As a result, it sometimes seems like the Fed is flying blind, or that its policy is vulnerable to being driven by politics, rather than economics.
In sum, non-conventional actions were crucial to stabilizing the markets during the GFC and Covid-19 crises, but they created financial imbalances, political challenges, and long-term dependencies that complicate the Fed’s policymaking.
And that’s not their only consequence.
Another byproduct of that era is the distortion of the credit cycle. It has not been repealed but has become elongated. While recent default rates are relatively modest and not making headlines, the use of non-traditional distress resolutions like liability management exercises (LMEs), payment-in-kind (PIK), and other restructurings where bondholder value is permanently impaired has increased. Reducing short-term risk (which essentially means delaying it) has become common practice for high-leverage issuers, especially PE sponsors, to avoid traditional bankruptcies. These tactics buy time but often do not result in positive outcomes. Bankers used to call them “pretend and extend.” As seen in Figure 1, despite a very favorable economic environment, risk levels are above average, particularly in the near term where interest rates remain elevated and refinancing is very expensive or unaffordable for many highly leveraged borrowers.
What will be the ultimate result of these delayed-risk transactions? We can’t tell, because many of them have moved to the “shadow banking” markets, where disclosures and transparency are minimal.
Despite the manageable level of short-term default risk, some sectors are exposed to longer-term risk. At the top of the list are highly leveraged firms that are rated BBB, high-yield, or private-equity sponsored. Elevated leverage, covenant-lite loans, and low rates have shifted the nature of risk from default risk to refinancing/rollover risk. Commercial real estate, especially office, retail, and leveraged CRE vehicles, face valuation risks from higher vacancies and a steeper yield curve. Regional and mid-sized banks continue to face a duration mismatch, combined with growing deposit flight. Households with high leverage are also vulnerable as spending and costs continue to increase.
The bottom line is that longer-term credit fragility sits at the intersection of high-leverage, liquidity mismatches and duration exposure, overlapping with structural changes in demand.
Where should you look for guidance in this complex environment, where manipulations have distorted values and risks are occluded?
A good place to start is by examining the term structure of default data, which can provide early insight into rising risks ahead of changes in market demand for those securities or loans. And don’t delay. First-mover advantage has never been more critical.
Figure 1: Median Cumulative Default Rate for United States Top 3000 Companies by Market Cap
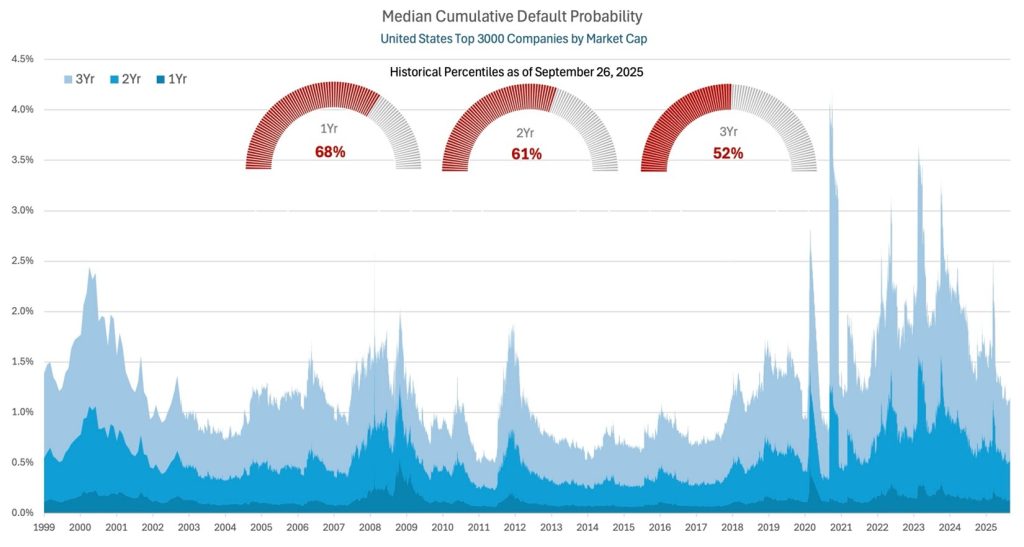
Source: SAS Institute KRIS data service
Contemporaneous Credit Conditions
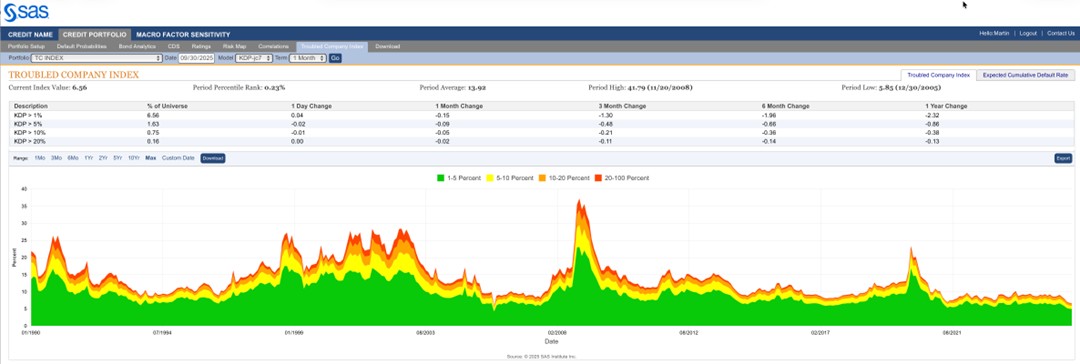
The Kamakura Troubled Company Index® closed the month at 6.56%, down 0.15% from the prior month. The index measures the percentage of 42,500 public firms worldwide with an annualized one-month default probability of over 1%. An increase in the index reflects declining credit quality, while a decrease reflects improving credit quality.
At the end of September, the percentage of companies with a default probability between 1% and 5% was 4.93%. The percentage with a default probability between 5% and 10% was 0.88%. Those with a default probability between 10% and 20% amounted to 0.59% of the total; and those with a default probability of over 20% amounted to 0.16%. For the month, short-term default probabilities ranged from a low of 6.45% on September 26 to a high of 6.77% on September 2.
Figure 2: Troubled Company Index®, September 30, 2025
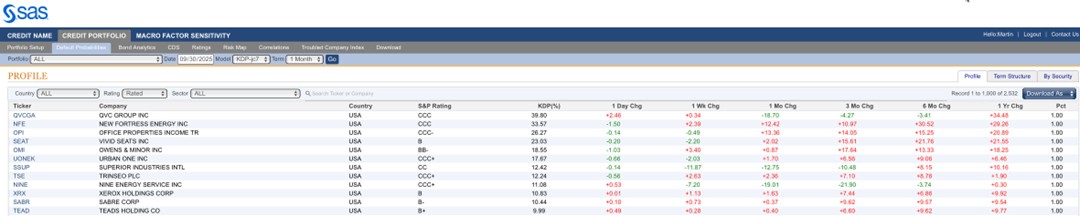
At the end of September, the riskiest 1% of rated public firms within the coverage universe as measured by 1-month default probability included twelve companies in the U.S. QVC Group, Inc (NASDAQ:QVCGA) remained the riskiest rated firm in our universe, with a 1-month KDP of 39.80%–down 18.70 over the past month.
Table 1: Riskiest Rated Companies Based on 1-month KDP, September 30, 2025
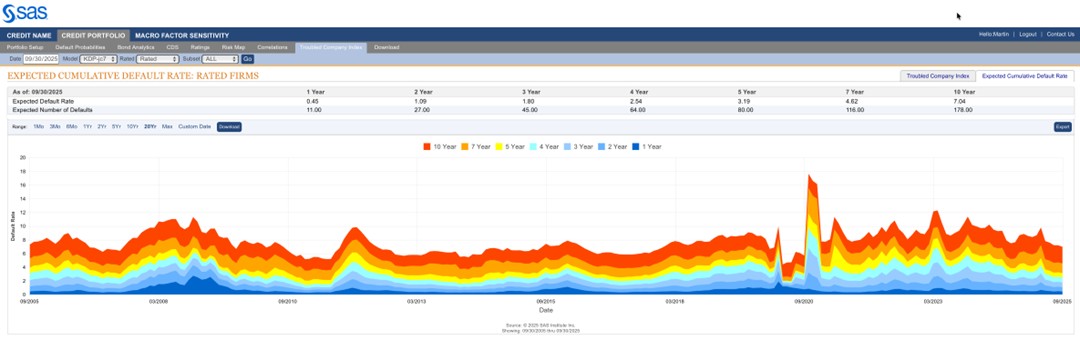
The Expected Cumulative Default Rate, the only daily index of credit quality of rated firms worldwide, shows the one-year rate of 0.45% up 0.01% from the prior month, with the 10-year rate up 0.05% at 7.05%.
Figure 3: Expected Cumulative Default Rates, September 30, 2025
About the Troubled Company Index
The Kamakura Troubled Company Index® measures the percentage of 42,500 public firms in 76 countries that have an annualized one-month default risk of over one percent. The average index value since January 1990 is 13.92%. Since July 2022, the index has used the annualized one-month default probability produced by the KRIS version 7.0 Jarrow-Chava reduced form default probability model, a formula that bases default predictions on a sophisticated combination of financial ratios, stock price history, and macro-economic factors.
The KRIS version 7.0 models were developed using a data base of more than 4 million observations and more than 4,000 corporate failures. A complete technical guide, including full model test results and key parameters, is provided to subscribers. Available models include the non-public-firm default model, the U.S. bank model, and the sovereign model.
The version 7.0 model was estimated over the period from 1990, through the Great Recession and ending in February 2022. The 76 countries currently covered by the index are Argentina, Australia, Austria, Bahrain, Bangladesh, Belgium, Belize, Botswana, Brazil, Bulgaria, Canada, Chile, China, Colombia, Croatia, Cyprus, Czech Republic, Denmark, Egypt, Estonia, Finland, France, Germany, Ghana, Greece, Hungary, Hong Kong, Iceland, India, Indonesia, Ireland, Israel, Italy, Japan, Jordan, Kenya, Kuwait, Luxembourg, Malaysia, Malta, Mauritius, Mexico, Nigeria, the Netherlands, New Zealand, Norway, Oman, Pakistan, Peru, the Philippines, Poland, Portugal, Qatar, Romania, Russia, Saudi Arabia, Serbia, Singapore, Slovakia, Slovenia, South Africa, South Korea, Spain, Sri Lanka, Sweden, Switzerland, Tanzania, Taiwan, Thailand, Turkey, the United Arab Emirates, Uganda, the UK, the U.S., Vietnam and Zimbabwe.
About SAS
SAS is the leader in analytics. Through innovative software and services, SAS empowers and inspires customers around the world to transform data into intelligence. SAS gives you THE POWER TO KNOW®.
Editorial contacts:
- Martin Zorn – Martin.Zorn@sas.com
- Stas Melnikov – Stas.Melnikov@sas.com