

Navigating An Uncharted Path
Kamakura Troubled Company Index Decreases by 0.13% to 8.20%
Credit Quality Improves Slightly to the 96th Percentile
NEW YORK, December 5, 2022: Data in the U.S. and Europe pointed to a weakening of inflationary pressure. Supplier delivery times fell considerably in November[1] while Baltic Dry Index (cost of shipping goods) is down to the pre-COVID levels. However, the U.S. jobs market remained strong, despite highly publicized announcements of layoffs. In his remarks last week, Federal Reserve Chair Jerome Powell reinforced market sentiment that future rate hikes would be moderate and that it was still possible that the Fed could achieve a soft landing. On the other hand, the global yield curve inverted for the first time in two years.
Credit conditions improved slightly to the 96th percentile of the period from 1990 to the present. The 100th percentile indicates the best credit conditions during that period. The Kamakura Troubled Company Index closed November at 8.20%, compared to 8.33% the month before. The index measures the percentage of 41,500 public firms worldwide with an annualized one-month default probability of over 1%. An increase in the index reflects declining credit quality, while a decrease reflects improving credit quality.
At the end of November, the percentage of companies with a default probability between 1% and 5% was 6.11%. The percentage with a default probability between 5% and 10% was 1.17%. Those with a default probability between 10% and 20% amounted to 0.66% of the total; those with a default probability of over 20% amounted to 0.26%. Short-term default probabilities ranged from a low of 7.92% on November 25 to a high of 8.32% on November 1. The largest change was among the percentage of riskiest companies between 1% and 5%, which dropped by 0.22%.
Figure 1: Troubled Company Index — November 30, 2022

At the end of November, the riskiest 1% of rated public firms within the coverage universe included 11 companies in the U.S. and one each in Germany and Luxembourg. The riskiest rated firm was Qualtek Services Inc. (QTEK:NASDAQ), with a one-month KDP of 34.94%, up 10.61% from the previous month. QTEK only began trading on NASDAQ in February of this year. There were two defaults in the KRIS coverage universe in November, with one each in Luxembourg and Sweden. Interestingly, there were 38 firms that either merged or were taken private during the month.
Table 1: Riskiest 1% Rated Companies Based on 1-Month KDP – November 30, 2022

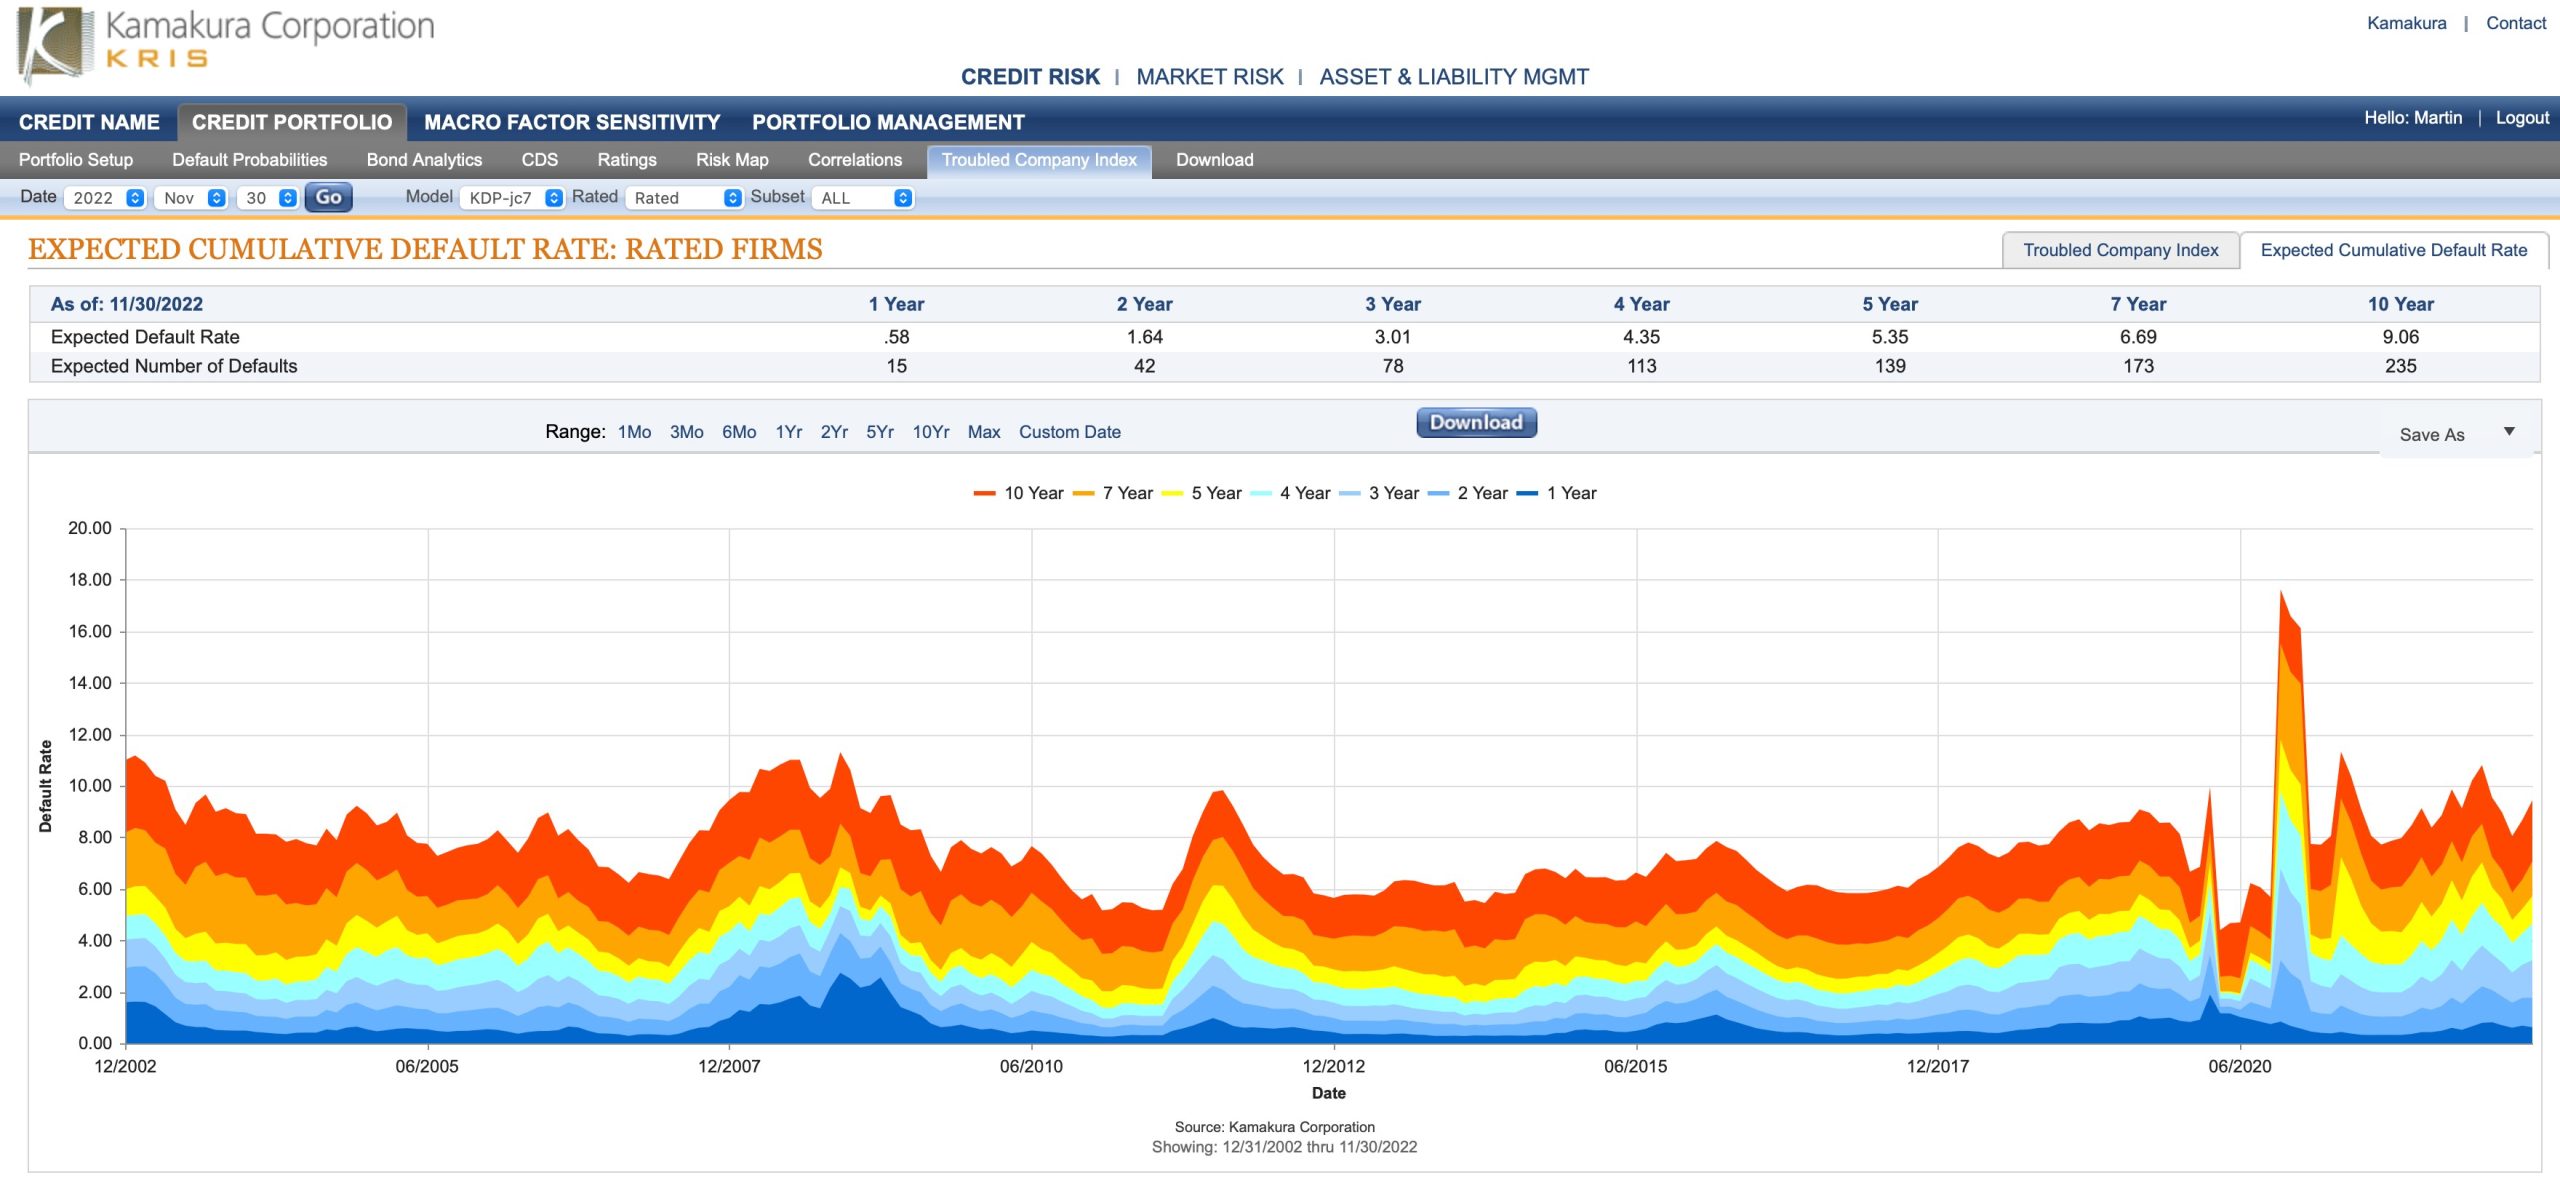
The Kamakura Expected Cumulative Default Rate, the only daily index of credit quality of rated firms worldwide, shows the one-year rate down 0.07% at 0.58%, and the 10-year rate down 0.66% at 9.06%. The 3-year expected cumulative default rate is 3.01%, compared to 2.69% at the beginning of the year.
Figure 2: Expected Cumulative Default Rate — November 30, 2022
Commentary
Stas Melnikov and Martin Zorn
SAS Institute Inc.
While the markets saw interventions by the Bank of England and the Bank of Korea in October, they broadly shrugged off the bankruptcy of FTX as a non-event. The longest-term impact of this fiasco will likely be a renewed debate about the role of regulations in the financial markets. Clearly, regulators want to maintain a keen focus on financial stability, depositor and consumer protection. We expect that the most immediate regulatory response to the FTX failure will be focused on the lack of controls and the causes of the collapse. The FTX saga raises an interesting question, given the sheer size and growth trends of the shadow banking market, as to what happens if there are defaults in commercial loans outside the regulated universe. If those defaults were to risk turbulence in financial stability, we would expect some type of intervention. But if stability is not threatened, we expect the result will be much like what we saw with FTX – caveat emptor.
Kamakura is working on a research project for a client focused on potential losses within Collateralized Loan Obligation (CLO) tranches. This has been one of most rapidly growing asset classes of structured debt, and now exceeds $1 trillion. Despite the market turbulence, over $100 million of CLOs were already issued this year. At this pace, 2022 is likely to end as second highest issuance year on record behind only 2021. While CLOs allow large institutional investors to lend to commercial borrowers, they also represent one of those asset classes that could be a catalyst for a contagion effect if there were a large default.
In the current risk environment, there are three key areas of rising risk: default risk, interest rate risk and market-liquidity risk. Higher borrowing costs, higher debt service coverage and difficulty in rolling over debt raise the risks of default. The rapid rise of inflation and the inverted yield curve, compared to negative interest rates of recent history, are challenging investors, lenders and borrowers alike. The changing risk factor relationships, the potential for a catalyst to require central bank intervention and enhanced mark to market risk could transform an isolated event into a liquidity crisis quickly.
In this environment, the key is understanding how to navigate uncertainty. This demands that you “know what you don’t know,” know what you can control, avoid black boxes and have a plan enabling you to respond swiftly. Among the most important strategies are developing an early warning system to detect regime changes and monitor for contagion, as well as having the ability to execute a rebalancing of your portfolio if conditions necessitate such action.
These strategies require high-frequency updates and recalibrations to your models, as well as automation in data quality, feature engineering, model deployment and model performance monitoring. An integrated balance sheet view and the use of multiple models have never been more important. The technology for these capabilities exists today. Risk managers will likely have to battle expense mandates within their organizations to ensure they have the tools necessary to avoid potential losses as the markets continue their journey down an uncharted path.
About the Troubled Company Index
The Kamakura Troubled Company Index® measures the percentage of 41,500 public firms in 76 countries that have an annualized one-month default risk of over one percent. The average index value since January 1990 is 14.38%. Since July 2022, the Kamakura index has used the annualized one-month default probability produced by the KRIS version 7.0 Jarrow-Chava reduced form default probability model, a formula that bases default predictions on a sophisticated combination of financial ratios, stock price history, and macro-economic factors.
The KRIS version 7.0 models were developed using a data base of more than 4 million observations and more than 4,000 corporate failures. A complete technical guide, including full model test results and key parameters, is provided to subscribers. The KRIS service also includes a wide array of other default probability models that can be seamlessly loaded into Kamakura’s state-of-the-art enterprise risk management software engine, Kamakura Risk Manager. Available models include the non-public-firm default model, the U.S. bank model, and the sovereign model. Related data includes market-implied credit spreads and prices on all traded corporate bonds traded in the U.S. market. Macro factor parameter subscriptions include Heath, Jarrow, and Morton term structure models for government securities yields in Australia, Canada, France, Germany, Italy, Japan, Russia, Singapore, Spain, Sweden, Thailand, the United Kingdom, and the United States, plus a 13-country “World” model. All parameters are derived in a no-arbitrage manner consistent with seminal papers by Heath, Jarrow, and Morton, as well as Amin and Jarrow.
The version 7.0 model was estimated over the period from 1990, through the Great Recession and ending in February 2022. The 76 countries currently covered by the index are Argentina, Australia, Austria, Bahrain, Bangladesh, Belgium, Belize, Botswana, Brazil, Bulgaria, Canada, Chile, China, Colombia, Croatia, Cyprus, Czech Republic, Denmark, Egypt, Estonia, Finland, France, Germany, Ghana, Greece, Hungary, Hong Kong, Iceland, India, Indonesia, Ireland, Israel, Italy, Japan, Jordan, Kenya, Kuwait, Luxembourg, Malaysia, Malta, Mauritius, Mexico, Nigeria, the Netherlands, New Zealand, Norway, Oman, Pakistan, Peru, the Philippines, Poland, Portugal, Qatar, Romania, Russia, Saudi Arabia, Serbia, Singapore, Slovakia, Slovenia, South Africa, South Korea, Spain, Sri Lanka, Sweden, Switzerland, Tanzania, Taiwan, Thailand, Turkey, the United Arab Emirates, Uganda, the UK, the U.S., Vietnam and Zimbabwe.
About SAS
SAS is the leader in analytics. Through innovative software and services, SAS empowers and inspires customers around the world to transform data into intelligence. SAS gives you THE POWER TO KNOW®.
Editorial contacts:
- Martin Zorn – Martin.Zorn@sas.com
- Stas Melnikov – Stas.Melnikov@sas.com

[1] https://www.kansascityfed.org/Manufacturing/documents/9249/Manufacturing-Survey-Nov-2022.pdf