

The Iran-war energy shock arrived at a fragile moment in the U.S. labor market. It was not because layoffs were surging, but because the labor market had shifted into a “low-hire, low-fire” equilibrium. The driving forces behind the unusual labor situation have been a major topic of discussion in many economic analysis pieces and are out of scope for this newsletter, where we will focus on the implications for corporate credit risk. In the March FOMC press conference, Chair Powell emphasized that job gains have remained low, the unemployment rate has been “little changed,” and that labor-force growth has slowed due to lower immigration and participation, while also noting that labor demand has softened. This combination matters for credit: a labor market can look stable on the surface (few layoffs) while still being less able to absorb shocks because hiring and mobility are subdued. The Richmond Fed put a fine point on the fragility in their excellent Macro Minute post[1]: historically, hiring rates at current levels have been associated with substantially higher unemployment, and continued declines in job openings would, by pre‑pandemic patterns, imply rising unemployment.
Against that labor backdrop, the war shock is best treated as an inflationary catalyst rather than a single-variable oil story. The Fed explicitly linked the rise in near‑term inflation expectations to the oil price increase caused by the Middle East supply disruptions. At the household level, the University of Michigan survey showed sentiment weakening and one‑year inflation expectations rising[2], with gasoline prices cited as a key driver. When employment growth is flat-lining, households have fewer options to “outrun” higher essentials costs via job switching, extra hours, or wage acceleration. The result is a tighter constraint on discretionary spending and a higher probability of margin pressure for firms that rely on consumer spending.
The immediate macro effect of the conflict was an increase in energy prices and a rise in inflation uncertainty. But rather than viewing this as a narrow “oil shock,” it is more constructive to treat it as a distributional shock that interacts with labor market conditions and household balance sheets in uneven ways. With flat-lining job growth, higher gasoline and essentials prices exert substantial pain for a subset of consumers.
This intersects directly with a theme emphasized in prior newsletters: the growing divergence within the U.S. consumer base. As discussed in November newsletter[3], post‑pandemic (and post‑AI) wealth gains have been driven largely by equities and real estate, benefiting households with significant asset exposure. For households without those buffers, inflation has been significantly more consequential. Evidence from consumer surveys continues to show that lower‑income households are more likely to be actively reducing spending and to cite income and employment conditions as the primary constraint.
That divergence is critical for interpreting the current credit signals. When the consumer is bifurcated and labor income growth is scarce, shocks propagate not through a uniform pullback but through selective demand weakness, concentrated in categories most sensitive to discretionary income. It is precisely these areas: leisure, apparel, childcare, casual dining, big‑ticket lifestyle consumption that have already appeared disproportionately in the tails of default probability distributions over recent quarters.
With that macro backdrop, we now turn to the distributional behavior of probabilities of default (PD) by GICS sector across 3000 largest firms in the United States and compare the two points in time: 3/27/26 and five weeks prior (and before the war) on 2/20/26. Figure 1 shows the %change in five percentiles (5th, 25th, Median, 75th and 95th) in PD distribution from 2/20 to 3/27. All but one bar on that chart is positive, indicating that the credit risk has risen across the spectrum. The first bar on the graph shows the change in the 5th percentile of the PD distribution. There is a uniform increase across all sectors (roughly 20%–40%), indicating that the risk floor has risen across the board, even though absolute PD levels at the low end remain modest.
Furthermore, the right tail of the distribution (the furthest green bar to the right) proportionately has been impacted the most: more than doubling in cases of Consumer Staples and Utilities[4]. While Staples are considered a defensive sector, they are quite vulnerable to margin shocks. This reflects second order effects of higher energy prices. For example, fertilizer production is highly dependent on LNG and the closure of the Strait of Hormuz has significant implications for fertilizer food supply food prices cycle. Utilities can be viewed as a long duration asset. Elevated inflation expectations are negative, especially for highly leveraged issuers. On the other side of the impact spectrum, Energy sector appears to be the most resilient to the shock. The war is a net cash-flow positive for many U.S. upstream energy producers due to higher prices.
Figure 1: Change (%) in Percentiles of the 1yr PD[5] Distribution by Sector from 2/20/26 to 3/27/26[6]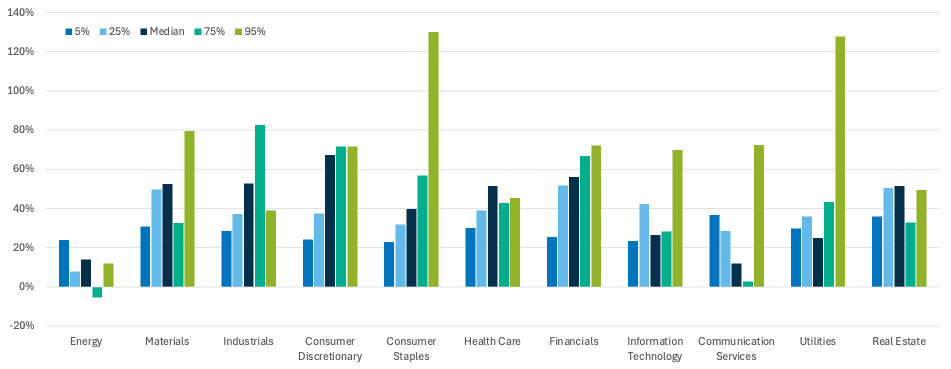
Figure 2: Percentiles of the 1yr PD Distribution by Sector – Box and Whiskers Plot (5%/ 25%/ 75%/ 95%)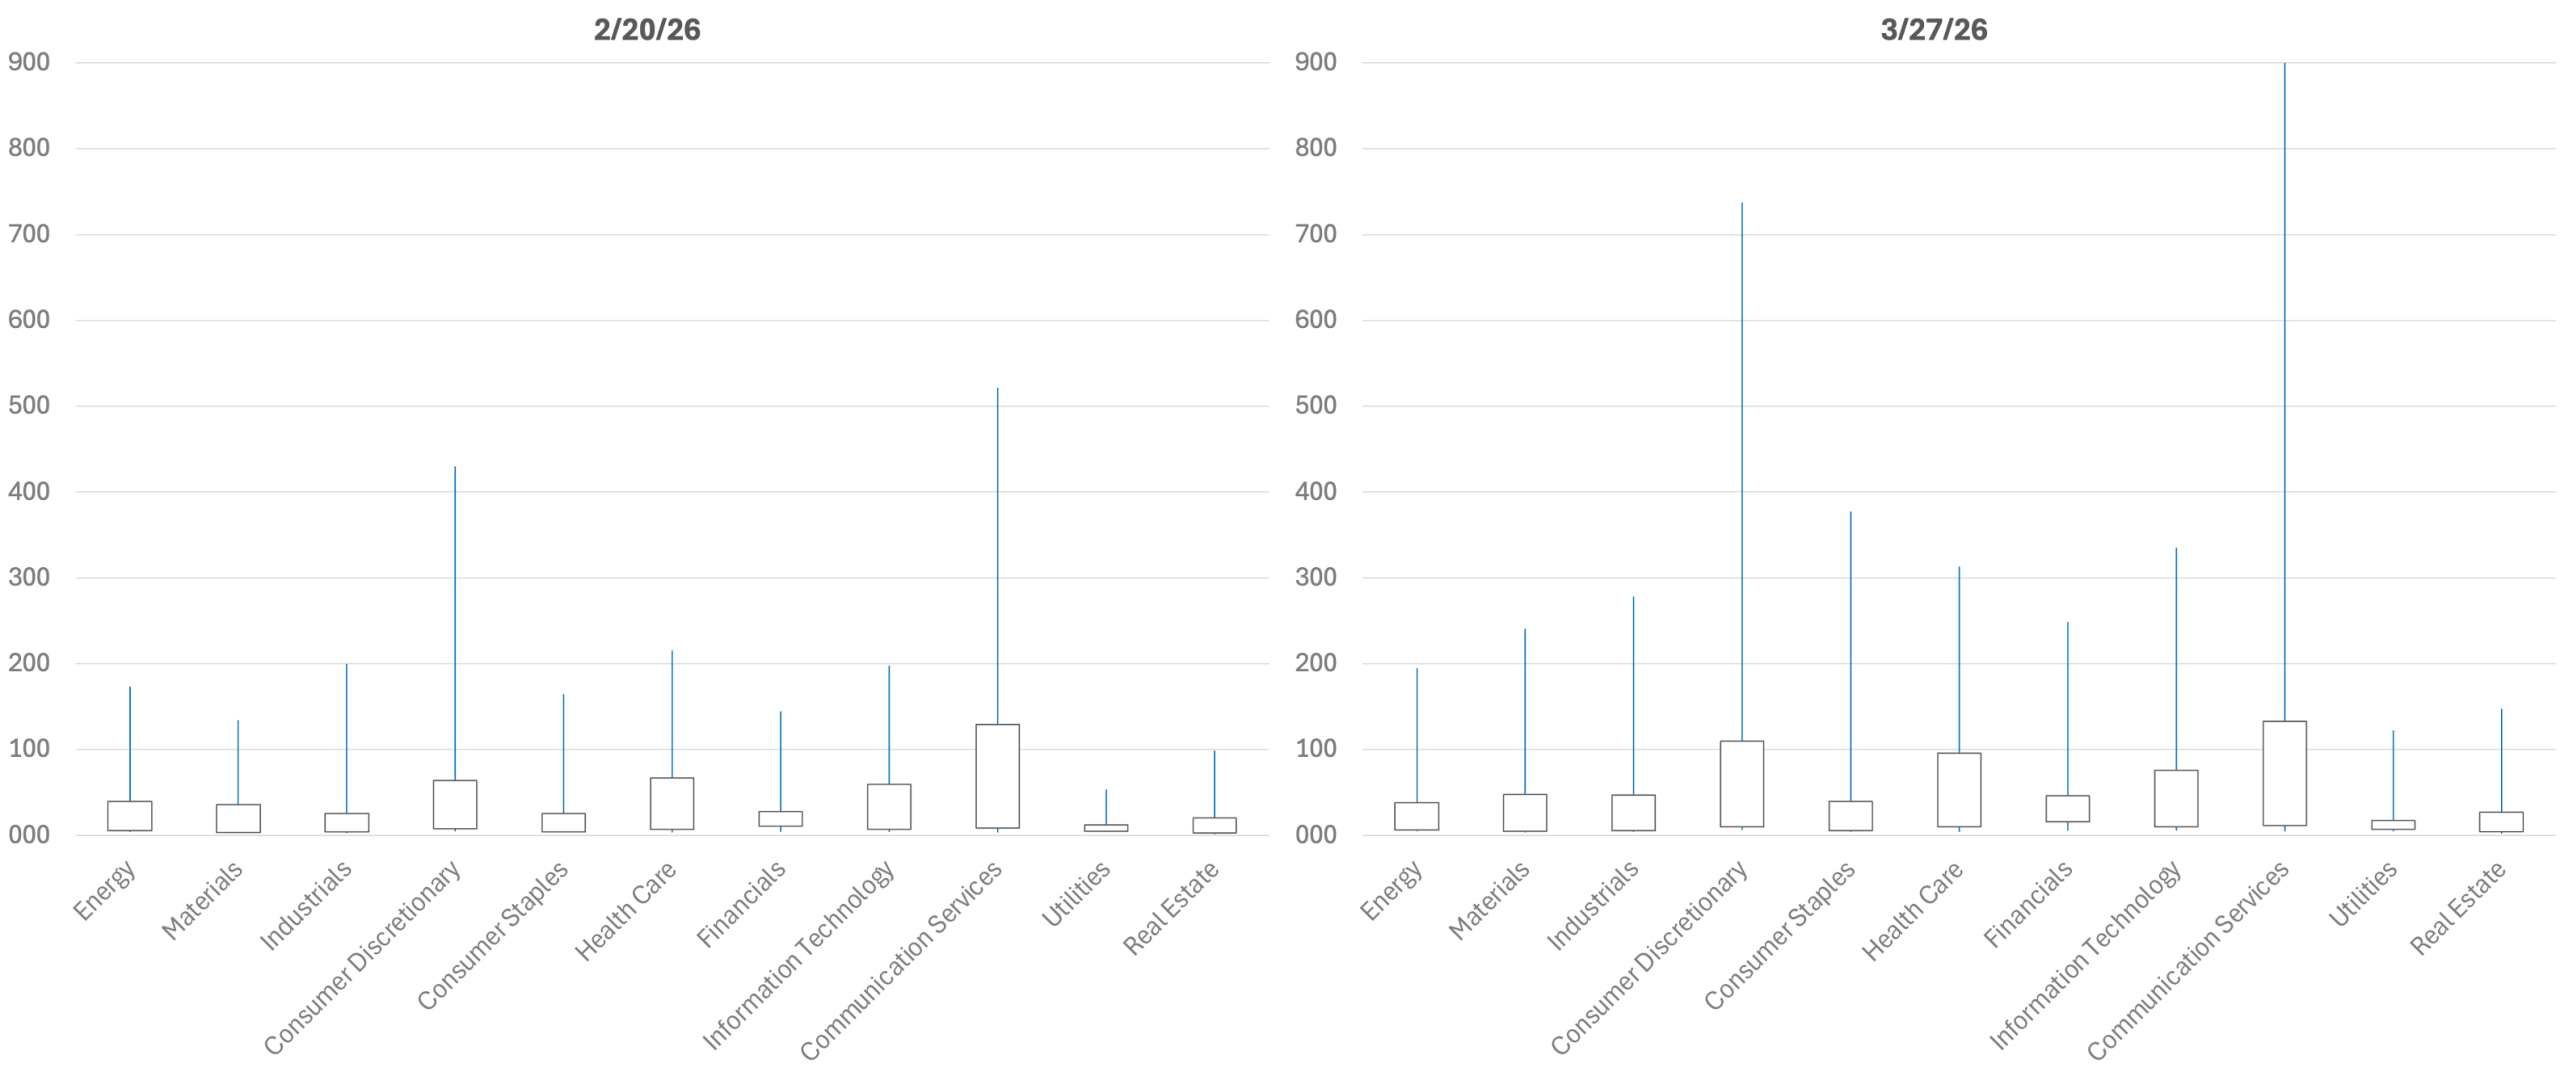
Taken together, March’s credit signals reflect the interaction of three forces: an energy shock that raised inflation uncertainty; a labor market characterized by low hiring rather than robust growth; and a consumer economy increasingly split between asset‑rich and asset‑constrained households. The result is a broad repricing of baseline credit risk, alongside widening dispersion within sectors.
In this environment, index‑level calm can coexist with meaningful shifts in underlying risk. Default probability distributions are not necessarily forecasting an immediate default cycle (when looked at in a market cap-weighted perspective), but they are signaling where resilience thins first. By count, this shock will be quite impactful for many smaller, less insulated firms. As this cycle continues, it is the shape of the distribution and not just the level of spreads, that defines risk.
Figure 3: Market Cap-Weighted Cumulative Default Probability – Top 3000 Companies in the US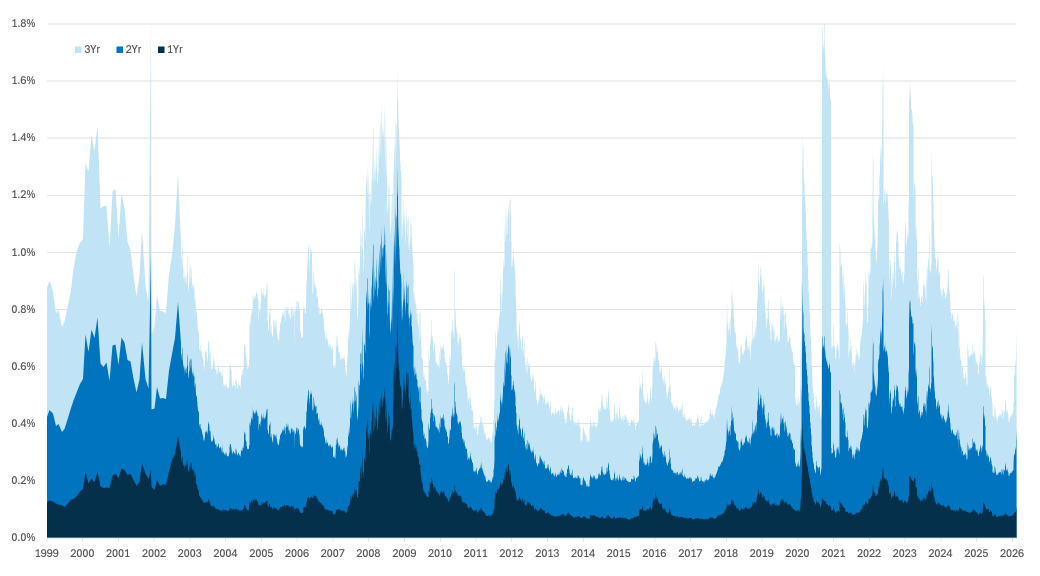
Figure 4: Median Cumulative Default Probability – Top 3000 Companies in the United States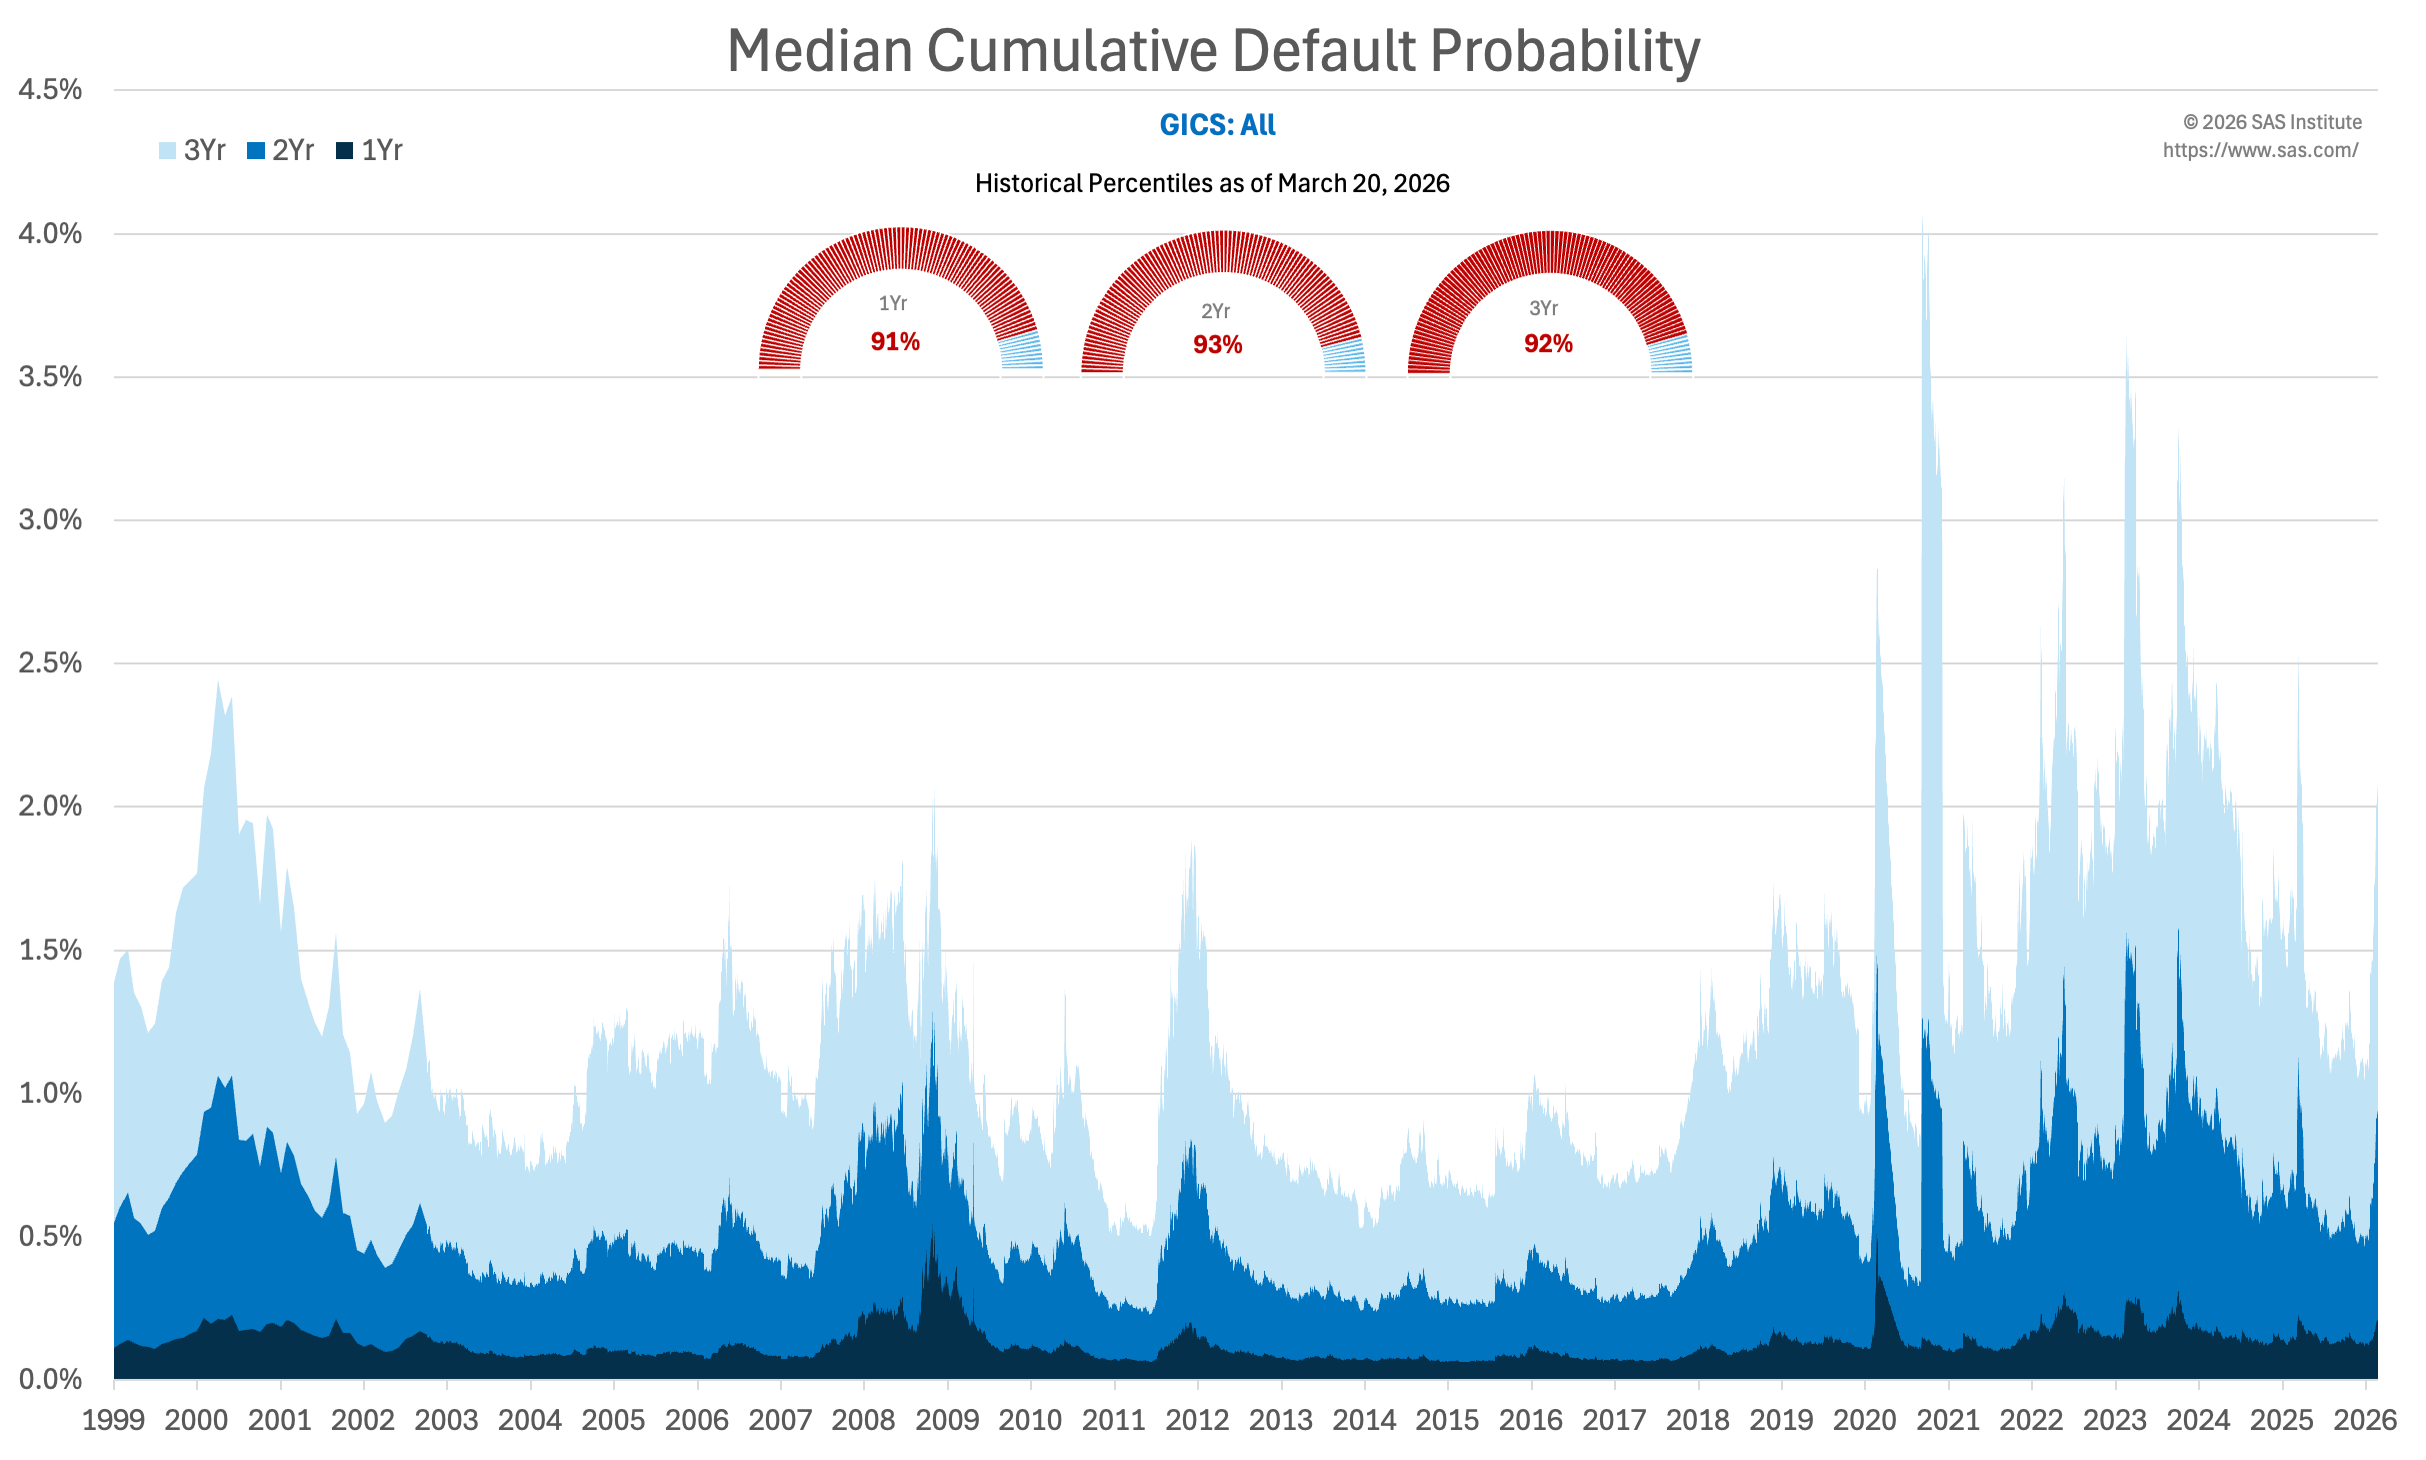
Table 1: Market Cap-Weighted Average 1-year Default Probability (Top 3000 Firms in the United States)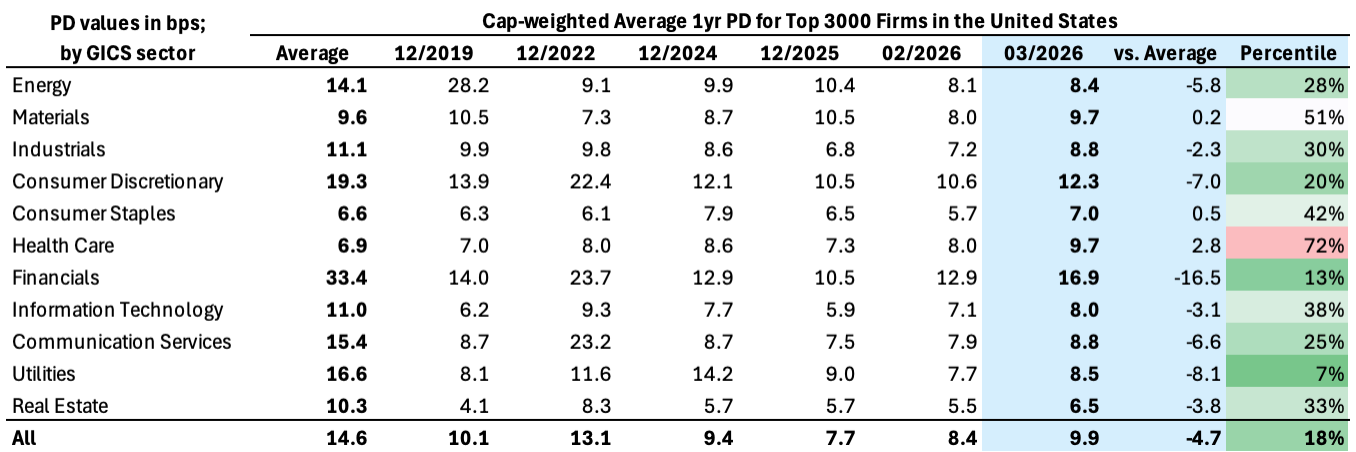
Table 2: Median 1-year Default Probability (Top 3000 Firms in the United States)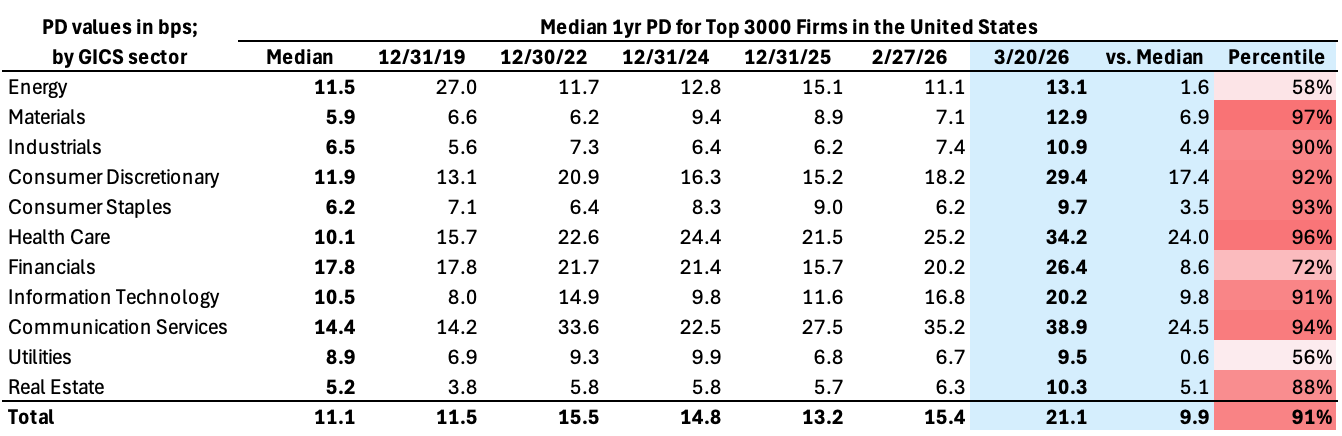
Why KRIS KDP matters now. Market prices can remain calm even as underlying risk concentrates, making model-based, issuer-level signals essential. KRIS default probabilities provide daily, issuer-level signals that make the bifurcation visible – pinpointing names where refinancing pressure, equity-vol shocks, or weakening coverage are rising even when spreads don’t budge. Used alongside market spreads and fundamentals, KDPs help identify issues not yet priced, providing actionable early warnings.
Appendix
Table 3: Riskiest Rated Companies Based on 1-month KDP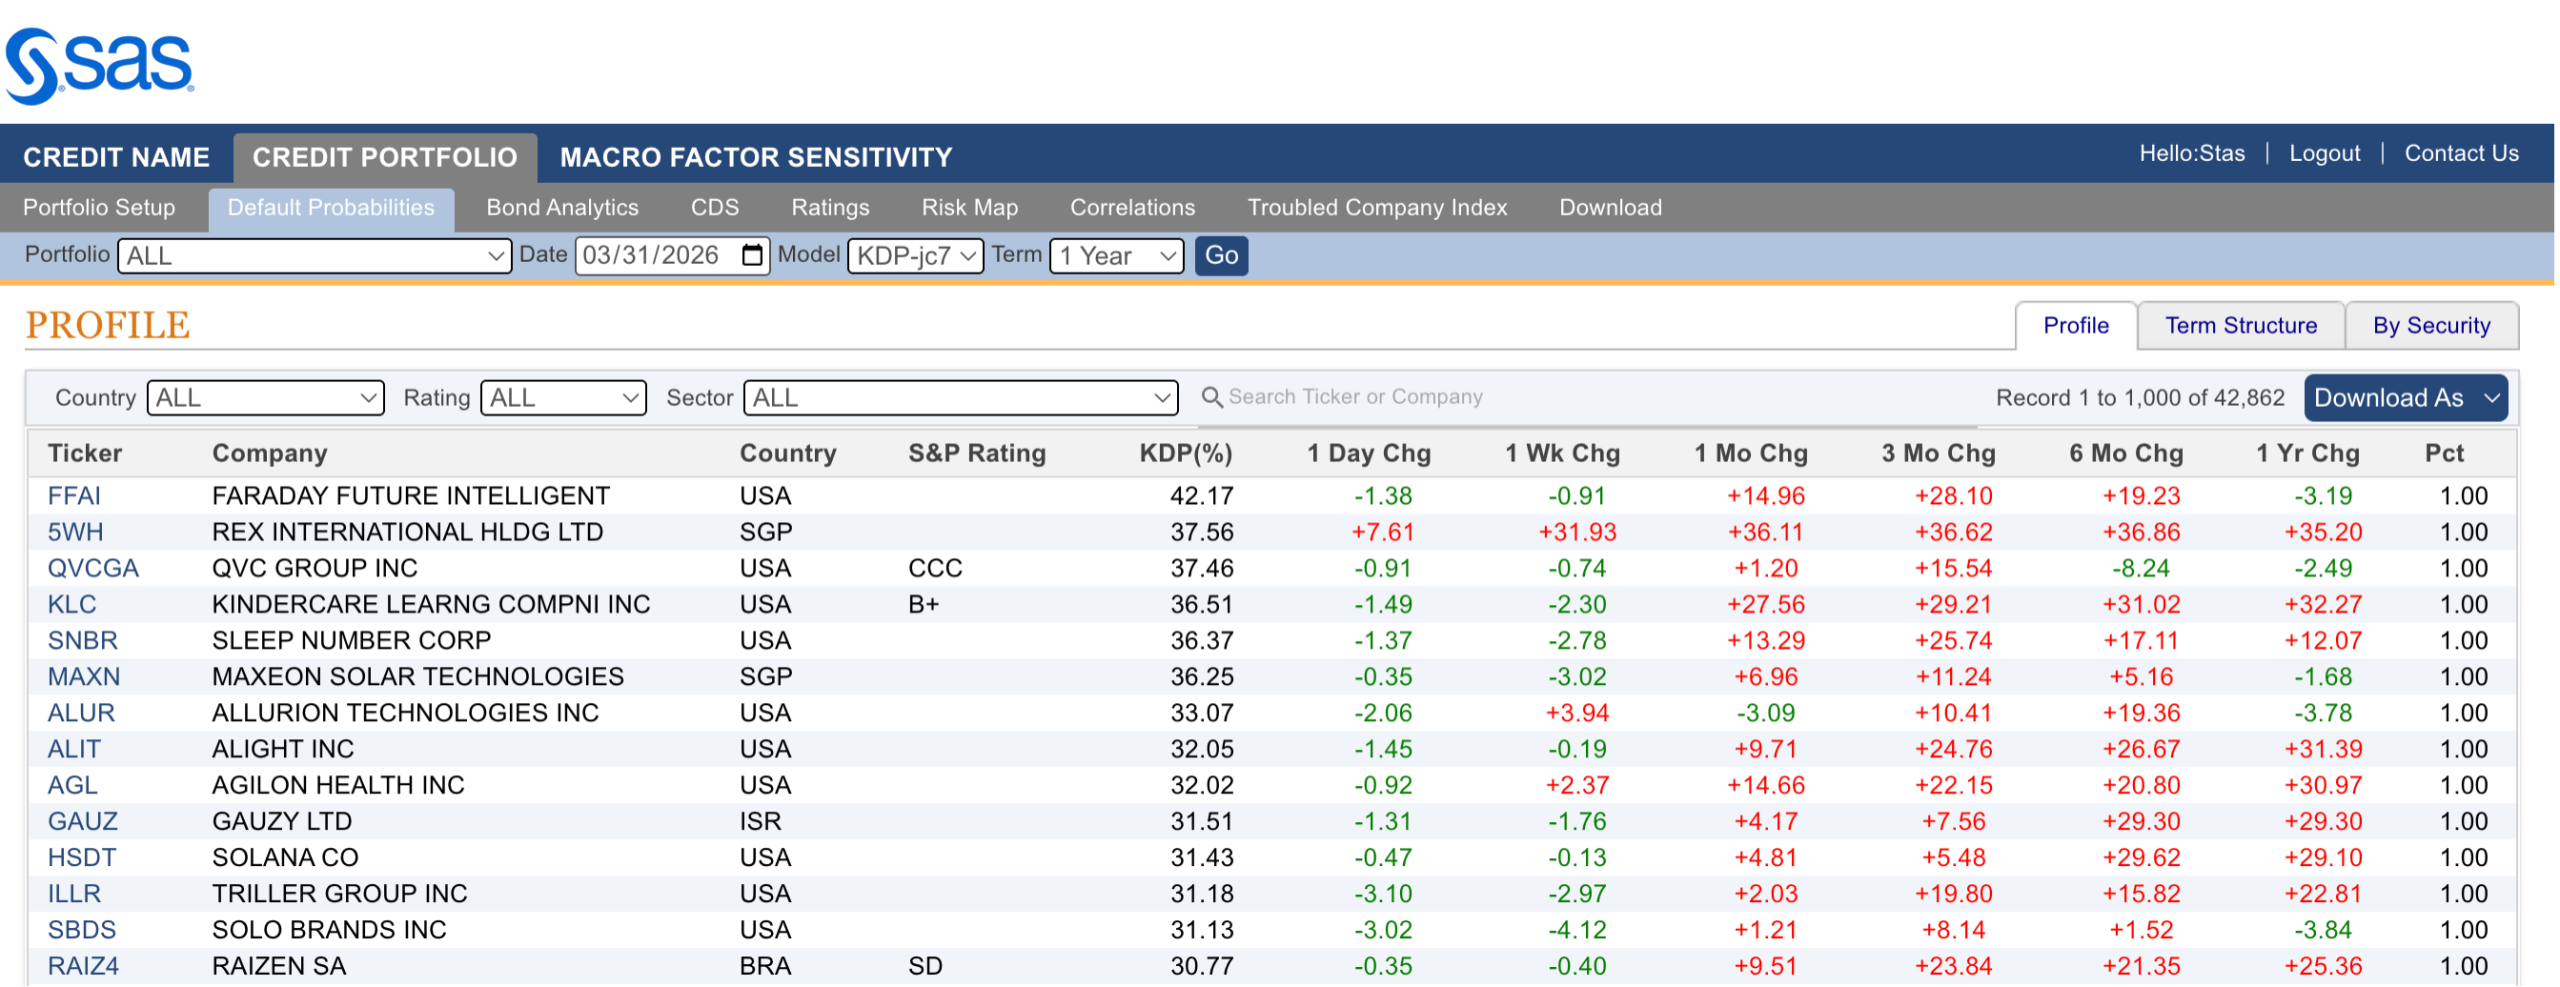
Table 4: Expected Cumulative Default Rates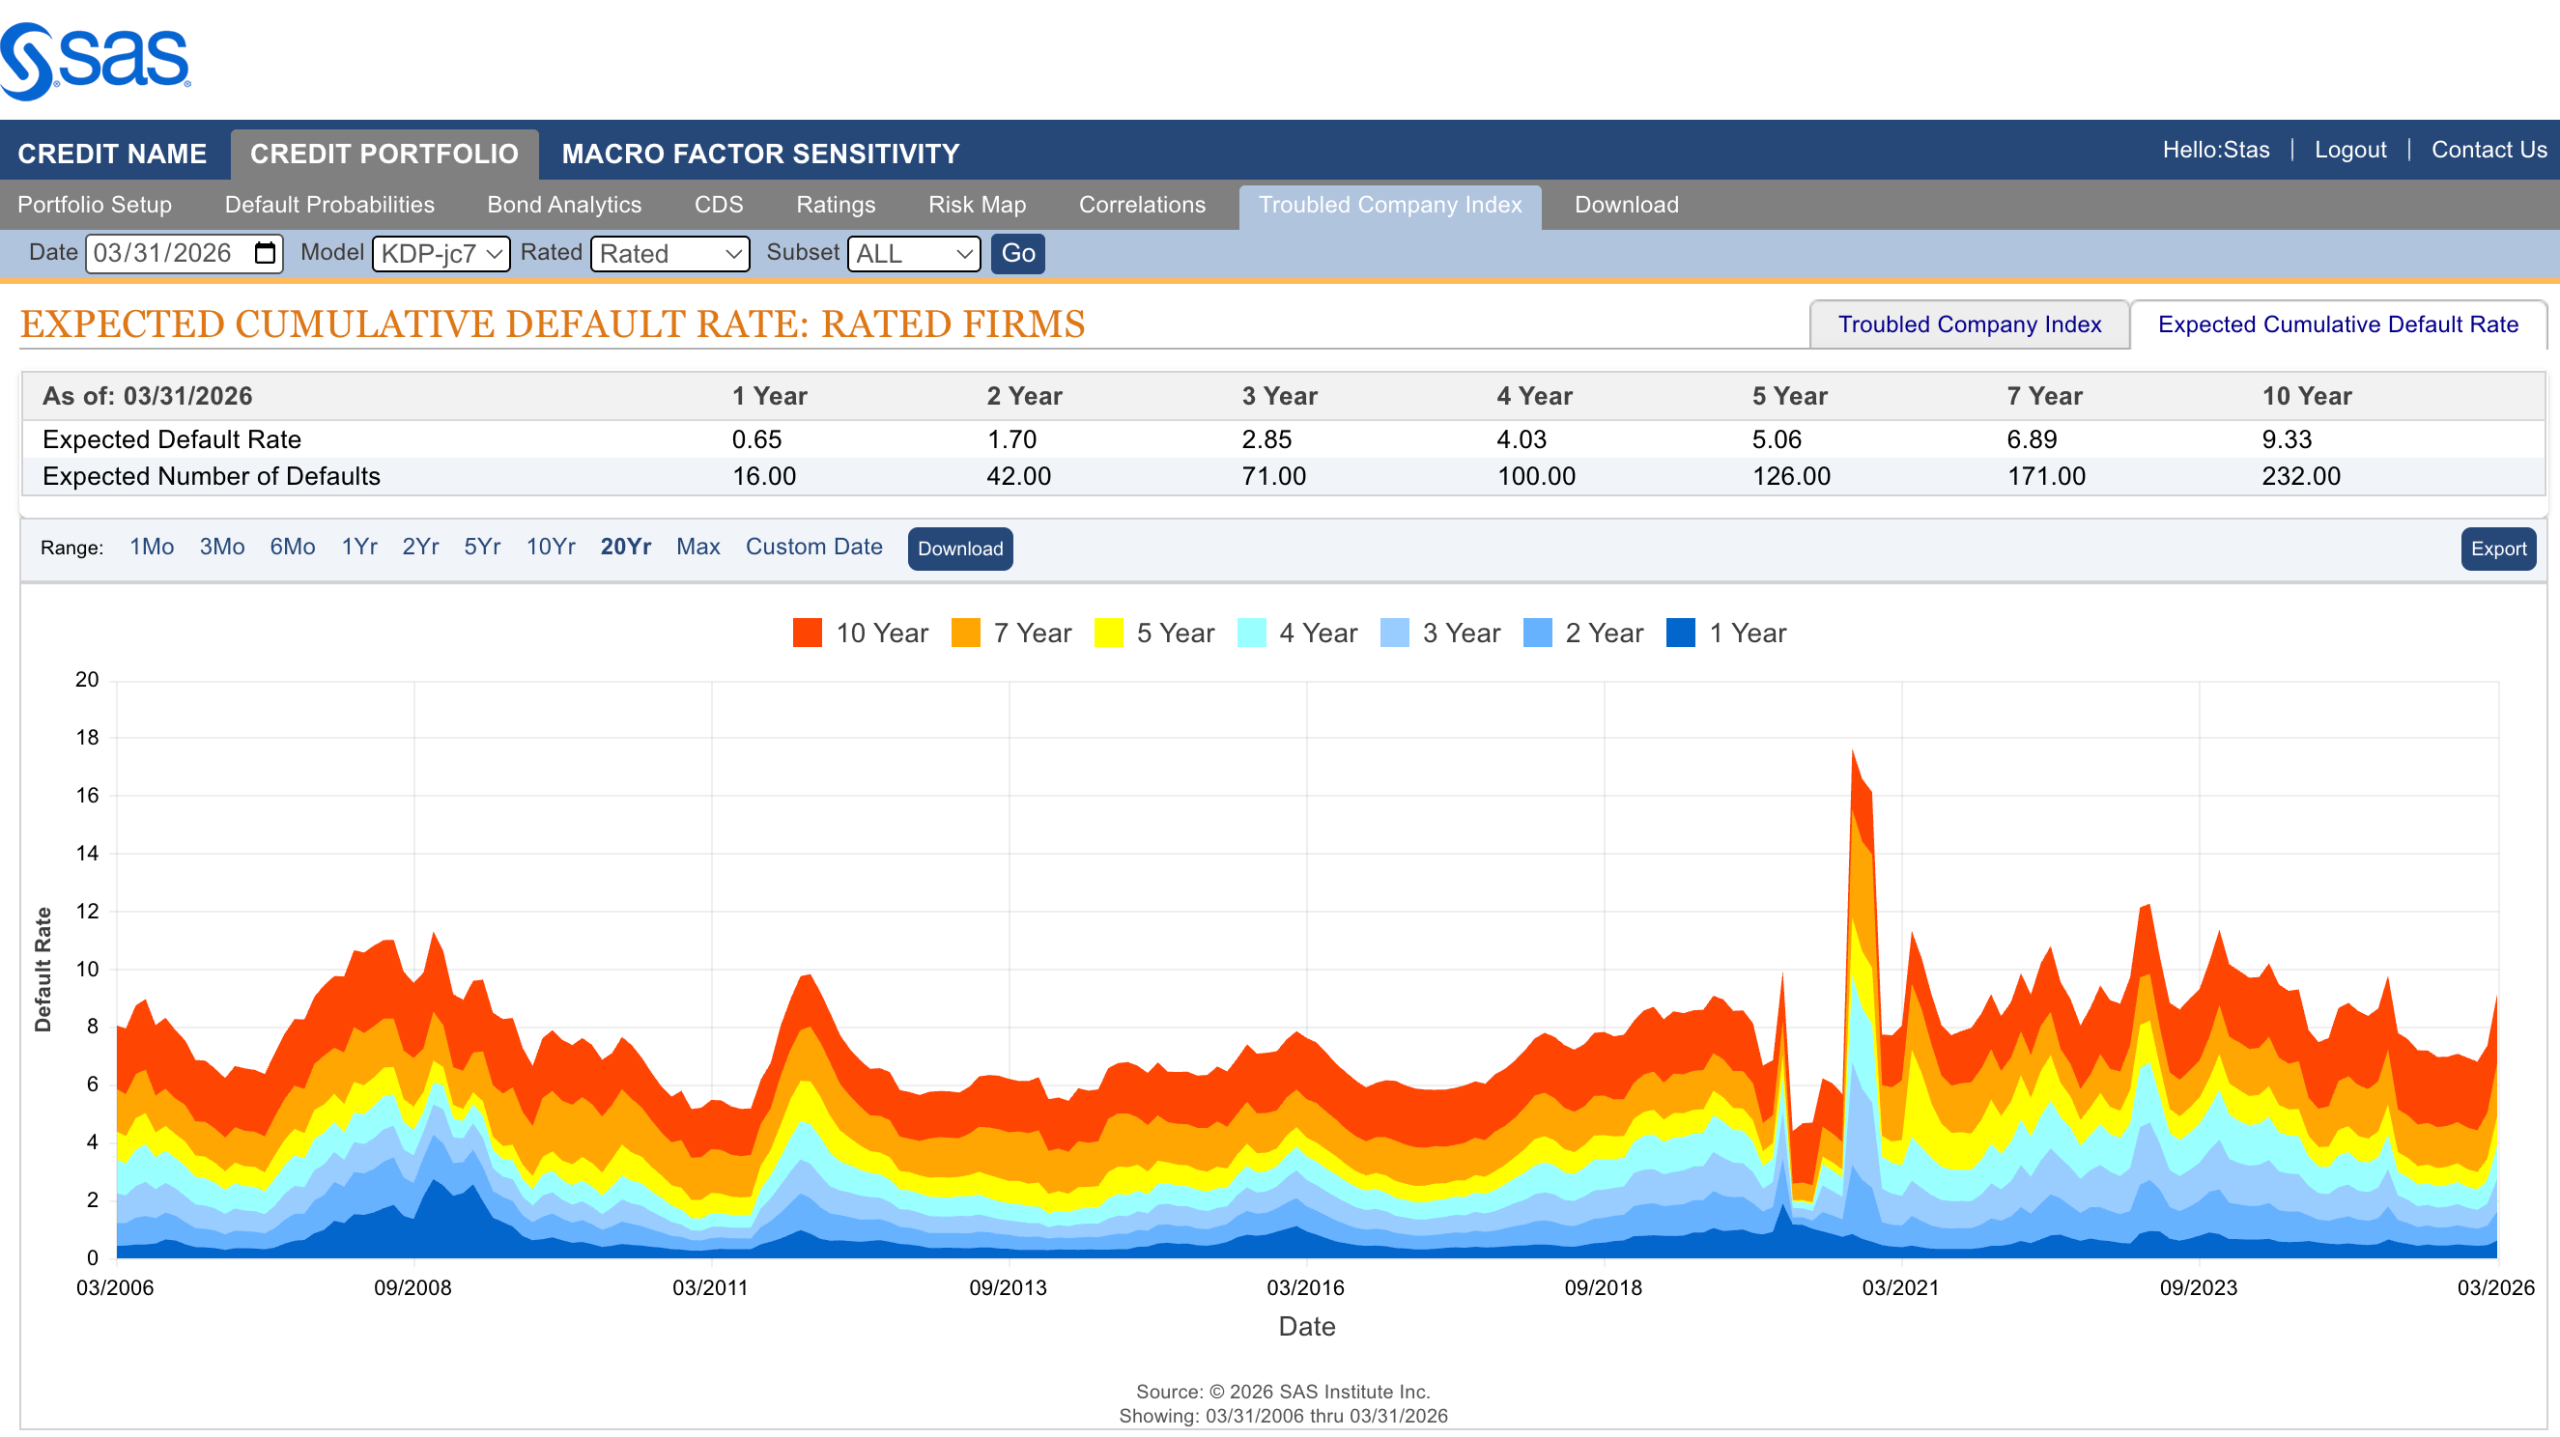
About SAS
SAS is the leader in analytics. Through innovative software and services, SAS empowers and inspires customers around the world to transform data into intelligence. SAS gives you THE POWER TO KNOW®.
Editorial contact: Stas Melnikov – stas.melnikov@sas.com
[1] https://www.richmondfed.org/research/national_economy/macro_minute/2026/jolting_labor_market_situation
[2] https://www.bloomberg.com/news/articles/2026-03-27/us-consumer-sentiment-slips-as-inflation-outlook-worsens-on-war
[3] https://www.kamakuraco.com/three-years-post-chatgpt/
[4] Utilities sector has a relatively small sample size (74 companies) that can lead to volatile tails of the distribution
[5] PDs represent Kamakura Default Probabilities (KDPs) from the KRIS® platform.
[6] Based on the top 3000 largest companies in the United States by equity market capitalization. Sectors are based on GICS classification.