

This month we take a global look at the impact of the Iran war on corporate credit risk via analysis of median probability of default (PD) for a select group of countries.
The initial corporate credit response to the Iran war shock was broad. Median 1yr PD rose across every country in the sample between February 27 and March 31, suggesting that the first-order effect was not simply physical energy exposure. It was a global repricing of inflation, policy, margin, and geopolitical risk. The magnitude of the shock, however, was quite modest, pointing to the resilience in the global economy. Figure 1 displays median 1yr PD time series at a country level for the past 5 years. The Iran war start is marked by the vertical red line on the chart. While the PD increase was swift and simultaneous, its magnitude generally was not outside the range that we saw over that period.
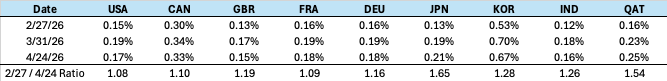
By late April, however, the pattern became more differentiated. Most developed markets partially retraced the March move. The U.S., U.K., France, Germany, Canada, and India all saw median KDPs decline from March-end levels, though most remained above pre-war levels. Refer to Table 1 for the exact PD figures.
Japan and Qatar were the notable exceptions. Japan’s median 1yr PD rose from 13 bps before the war to 21 bps by April 24, with no April retracement. That is consistent with an economy importing the shock through energy dependence and supply-route vulnerability. Qatar’s median PD rose from 16 bps to 25 bps, also continuing higher in April. That suggests that for Gulf-linked economies, higher hydrocarbon prices may be outweighed by regional disruption, export-route risk, and confidence effects. While multiple factors may be at work, the persistence of elevated PDs points to a more direct linkage to regional risk.
Korea remains the highest-risk economy in the sample, with median 1yr PD of 67 bps, up from 53 bps pre-war. But its April decline from 70 bps suggests sustained elevation rather than renewed acceleration.
The takeaway is that the Iran war shock is not showing up as a simple energy-importer versus energy-exporter split. The better interpretation is a two-stage repricing: a broad March global credit shock, followed by persistent April pressure in economies where the shock is more directly connected to energy-route dependence or regional conflict exposure.
Figure 1: Country-level Median 1yr PD (2021 – Current)
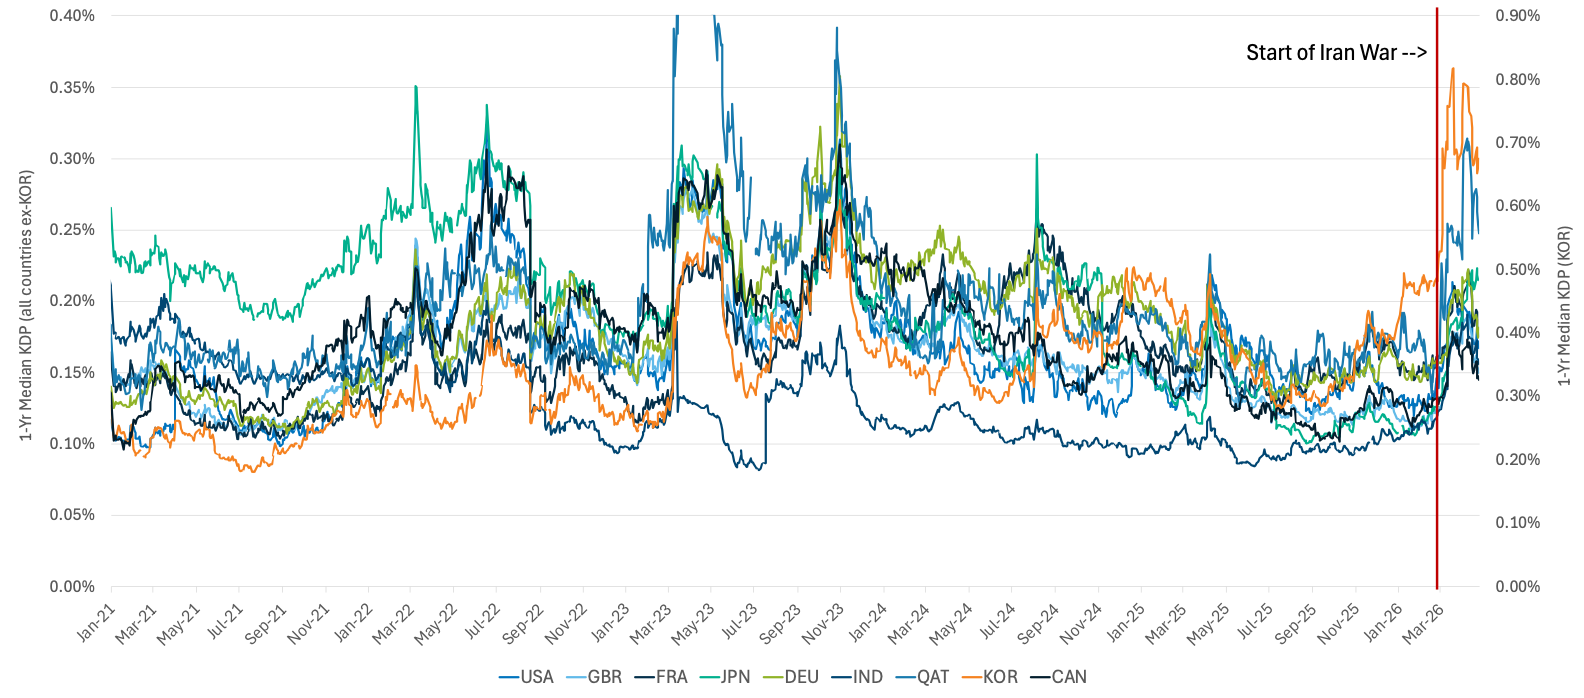
Table 1: Country-level Median 1yr PD
Zooming in on the United States, the median PDs continue to be elevated. Cap-weighted PDs have risen from their cycle lows and now stand at the levels consistent with historic averages. The notable feature of this increase is its uniformity across sectors. It appears that the corporate credit market as a whole is being repriced toward historical norms, driven by less accommodative financial conditions.
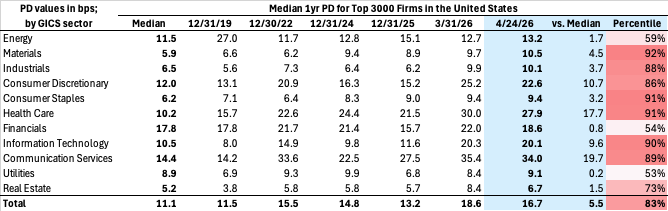
Some sectors warrant a closer look. Healthcare (which has been under stress for an extended period), Consumer Staples and Materials are now in the top quartile of their historic PD range even on a cap-weighted basis. This suggests that the combined effects of elevated interest rates, tariffs, and supply‑chain disruptions are beginning to take a more visible toll on corporate credit risk. We will explore these dynamics in greater detail in subsequent publications.
Figure 2: Market Cap-Weighted Cumulative Default Probability – Top 3000 Companies in the US
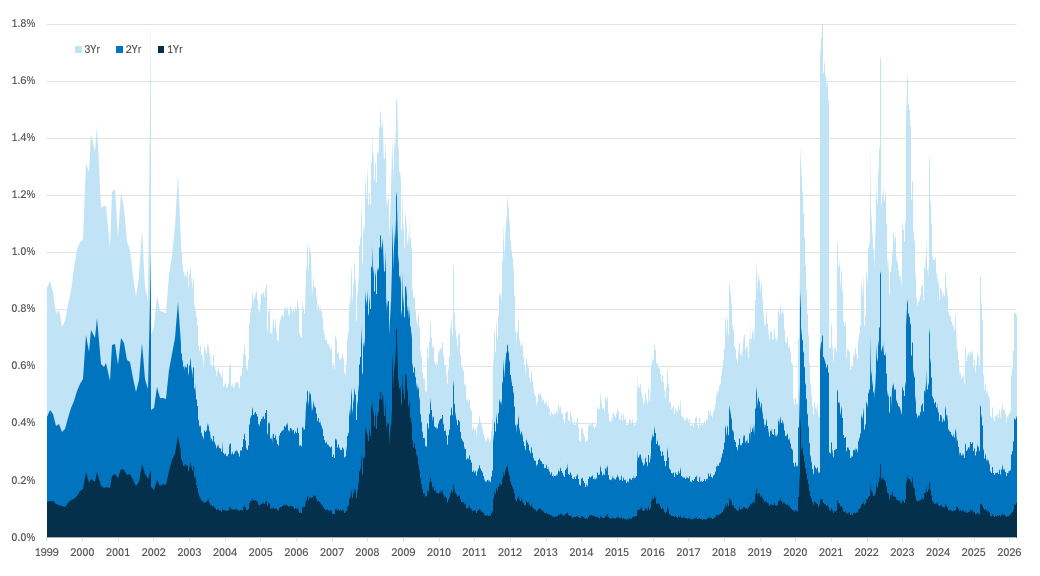
Figure 3: Median Cumulative Default Probability – Top 3000 Companies in the United States
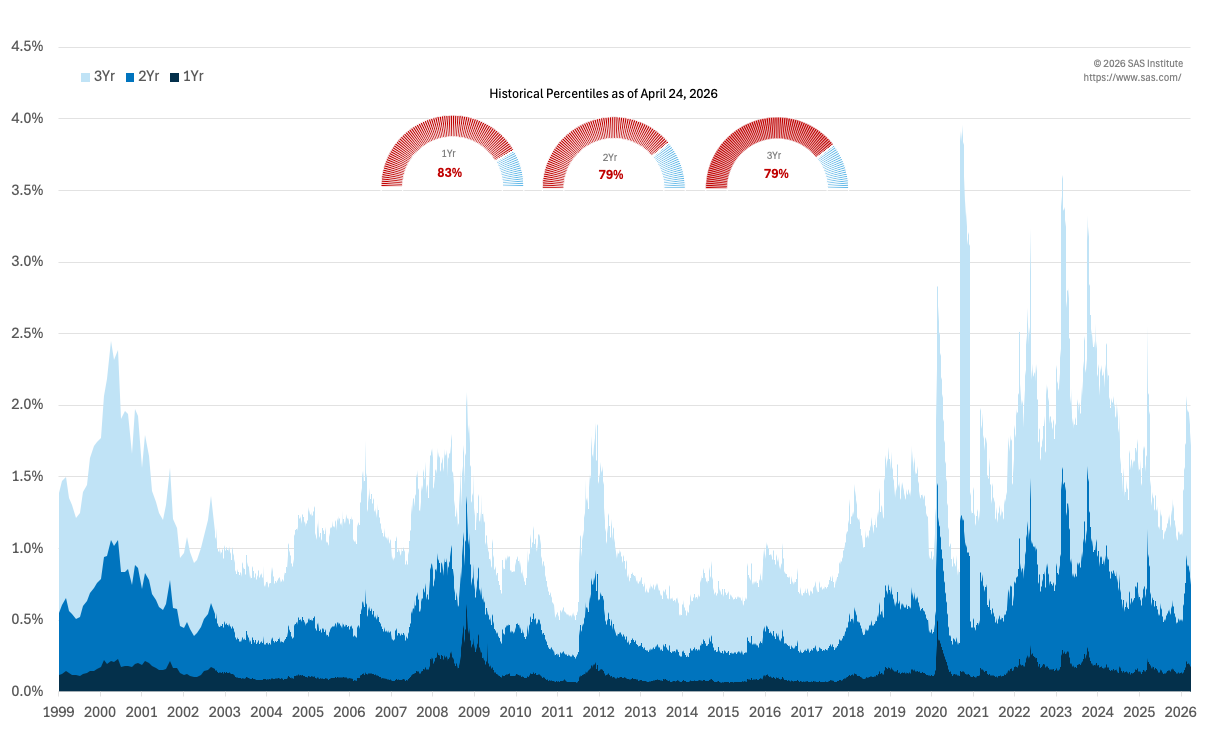
Table 2: Market Cap-Weighted Average 1-year Default Probability (Top 3000 Firms in the United States)
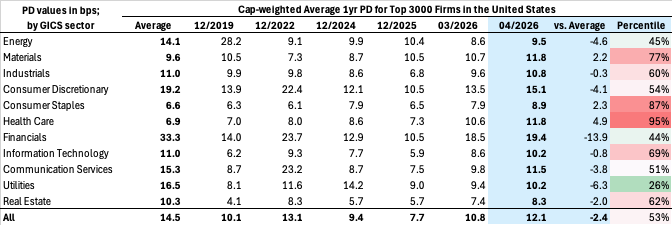
Table 3: Median 1-year Default Probability (Top 3000 Firms in the United States)
Why KRIS PD forecasts matters now. Market prices can remain calm even as underlying risk becomes more concentrated, making model‑based, issuer‑level signals increasingly important. KRIS default probabilities provide daily, issuer‑level signals that help make this bifurcation visible: pinpointing names where refinancing pressure, equity‑volatility shocks, or weakening coverage metrics are emerging even when credit spreads do not move. Used alongside market spreads and fundamental analysis, PDs help identify risks that are not yet fully priced, providing actionable early‑warning signals.
Appendix
Table 4: Riskiest Rated Companies Based on 1-year PD
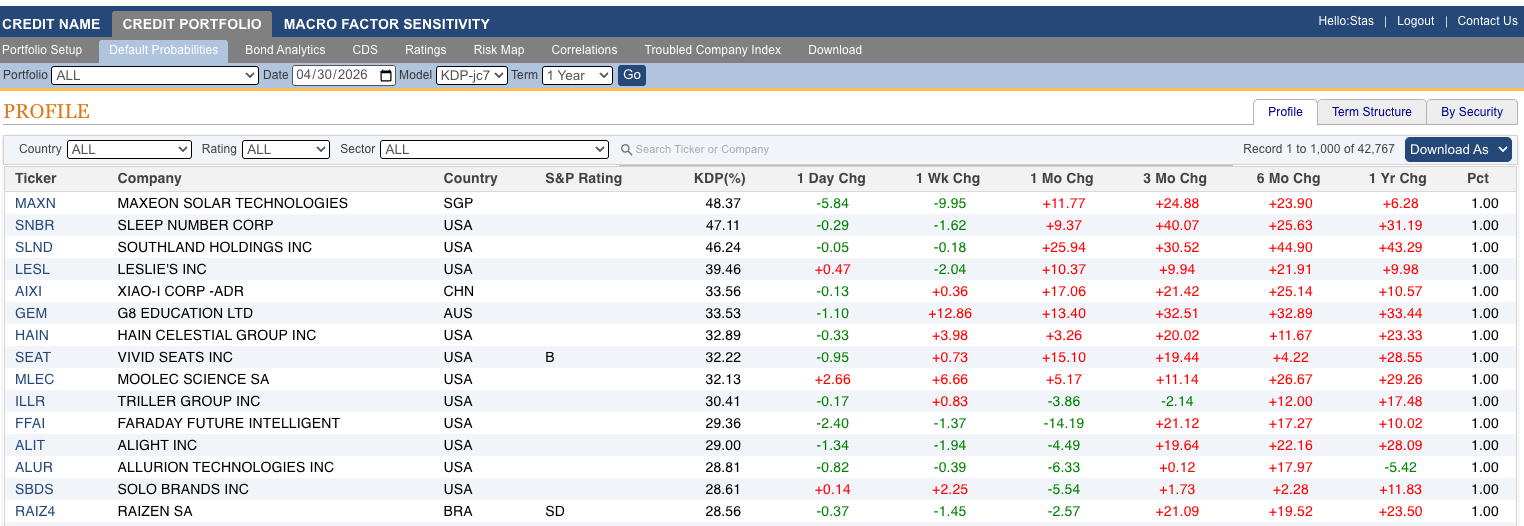
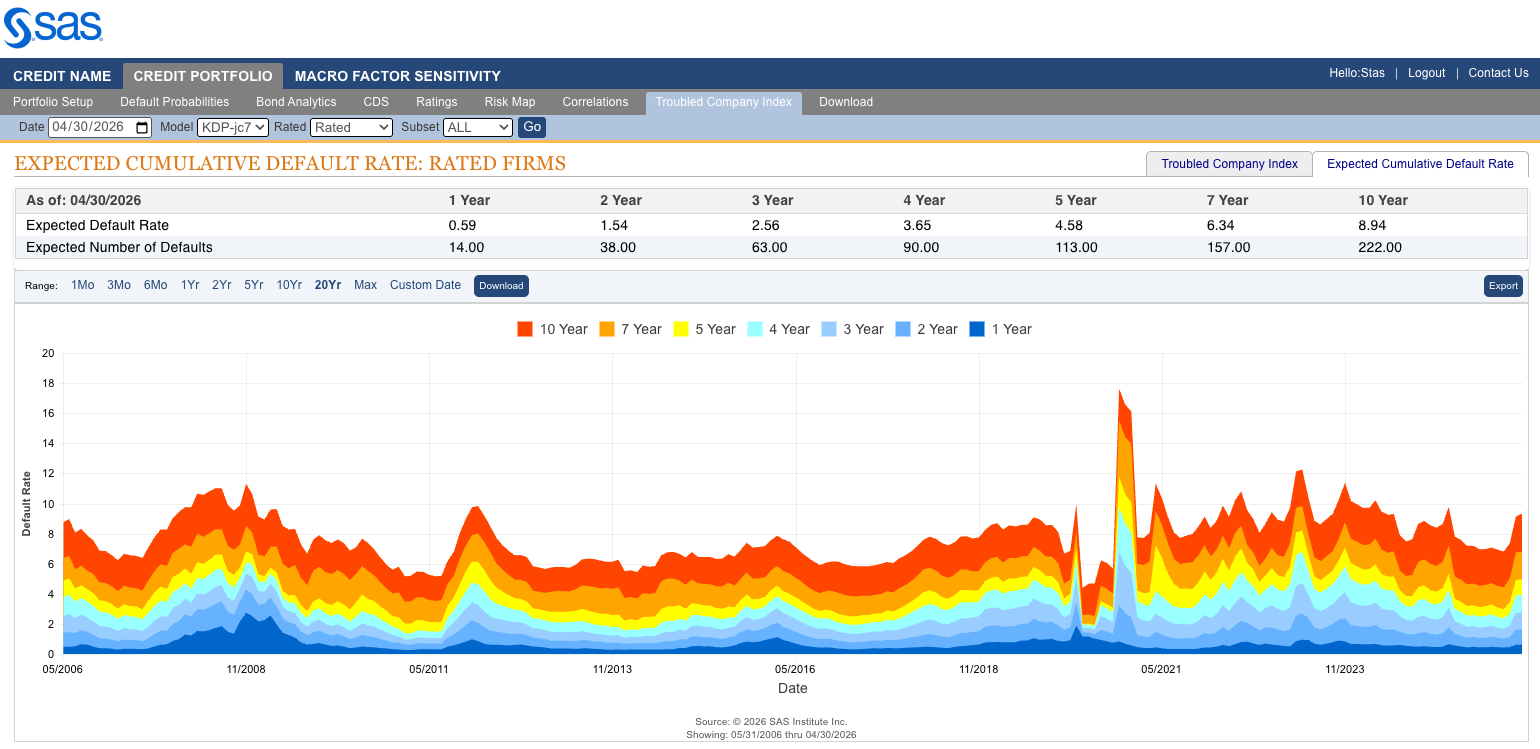
Figure 4: Expected Cumulative Default Rates
About SAS
SAS is the leader in analytics. Through innovative software and services, SAS empowers and inspires customers around the world to transform data into intelligence. SAS gives you THE POWER TO KNOW®.
Editorial contact: Stas Melnikov – stas.melnikov@sas.com