Even Soft Landings Are Bumpy
NEW YORK, February 3, 2023: As February began, the Federal Reserve slowed its rate-tightening with just a quarter-point rise. The markets had a good month in January—in fact, the S&P 500 experienced its best January in four years. But questions remain about whether this progress can be sustained and what the market action means with respect to default probability and credit risk over the next few years, especially since the short-term credit outlook remains benign.
Contemporaneous credit conditions improved slightly as the Kamakura Troubled Company Index closed January at 7.46%, down 0.55% from the prior month. The index measures the percentage of 41,500 public firms worldwide with an annualized one-month default probability of over 1%. An increase in the index reflects declining credit quality, while a decrease reflects improving credit quality.
At the end of January, the percentage of companies with a default probability between 1% and 5% was 5.55%. The percentage with a default probability between 5% and 10% was 1.03%. Those with a default probability between 10% and 20% amounted to 0.63% of the total; those with a default probability of over 20% amounted to 0.25%. Short-term default probabilities ranged from a low of 7.41% on January 17 to a high of 8.01% on January 2.
Figure 1: Troubled Company Index — January 31,2023

At the end of January, the riskiest 1% of rated public firms within the coverage universe included seven companies in the U.S. and one each in Germany, Luxembourg, and the UK. The riskiest rated firm was National CineMedia (NCMI:NASDAQ), with a one-month KDP of 29.13%, up 2.98% from the previous month. There were six defaults in the KRIS coverage universe in January, with two each in China and the U.S. and one each in Brazil and Thailand.
Table 1: Riskiest 1% of Rated Companies Based on 1-Month KDP – January 31, 2023
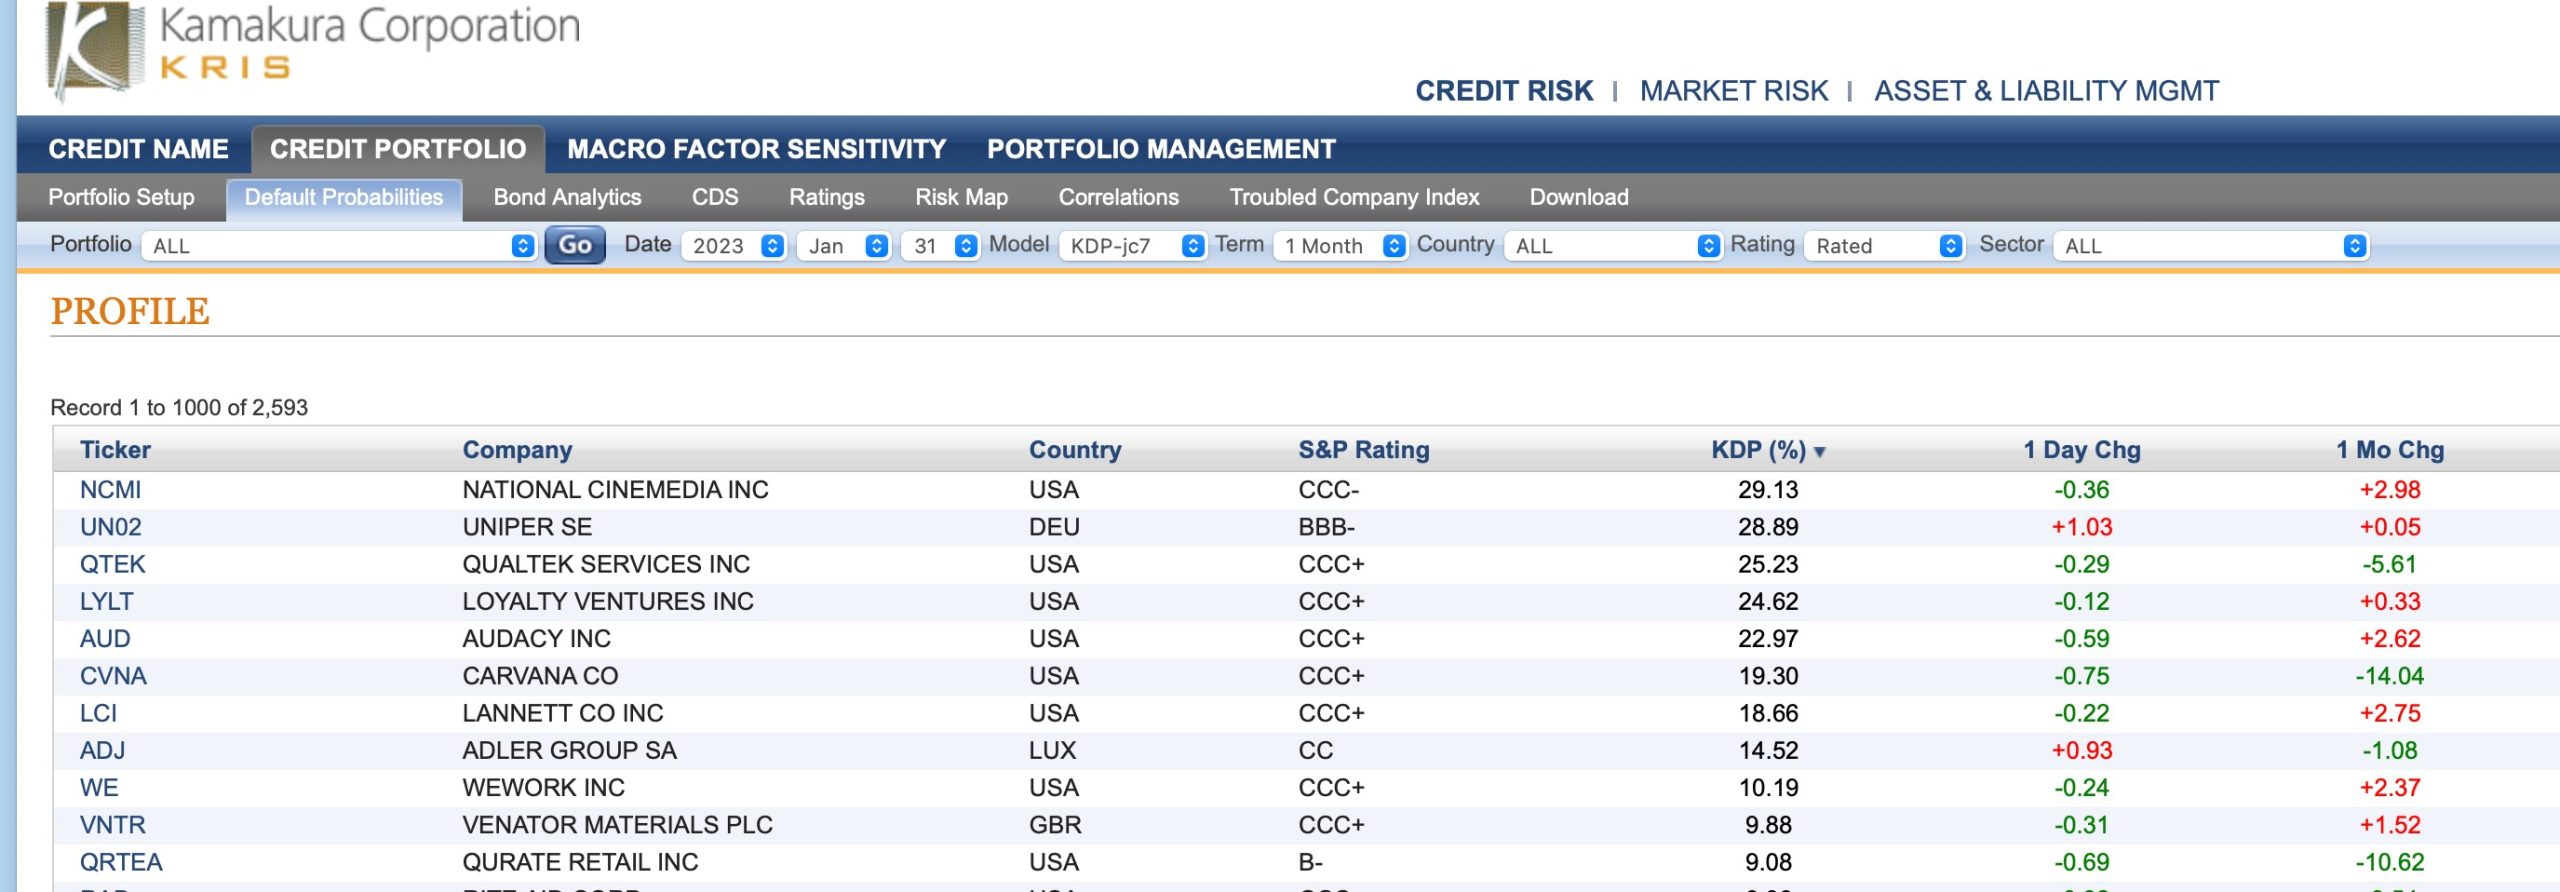
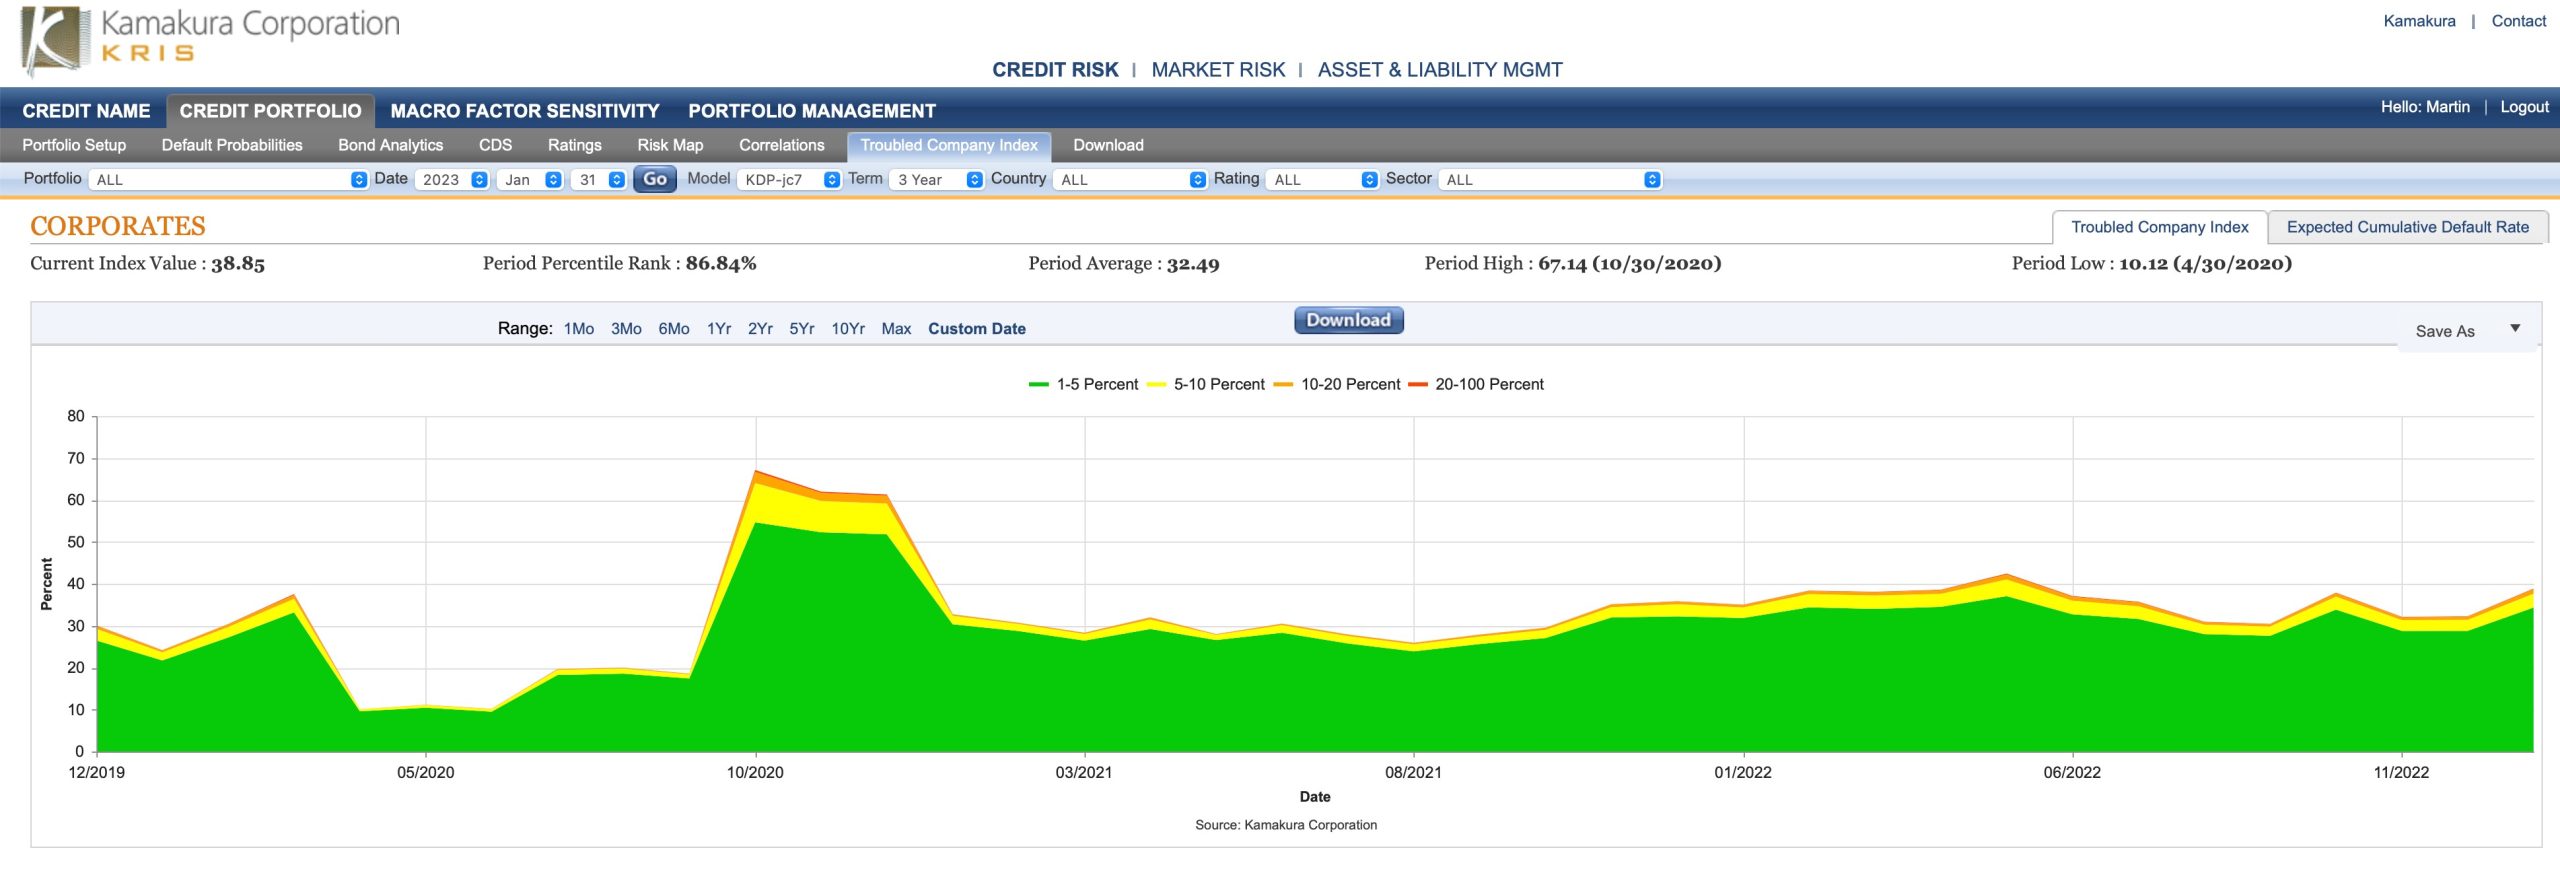
The one-month default probability, shown in Table 1 above, measures the likelihood of default over a short time horizon. Despite rising rates, tighter underwriting and a slowing economy, companies remain relatively flush with cash as a result of Covid-era policies and opportunistic financing. Figure 2 below looks at the three-year risk of default in the Kamakura coverage universe since the first reports of Covid-19 in December 2019. From this chart we can see the effects of government policies following the outbreak, as well as the risk posed by supply chain interruptions as the world began to reopen. We also see a slow but rising level of default probabilities for the three-year term.
Figure 2: 3-Year term Default Probabilities since Covid Outbreak Began
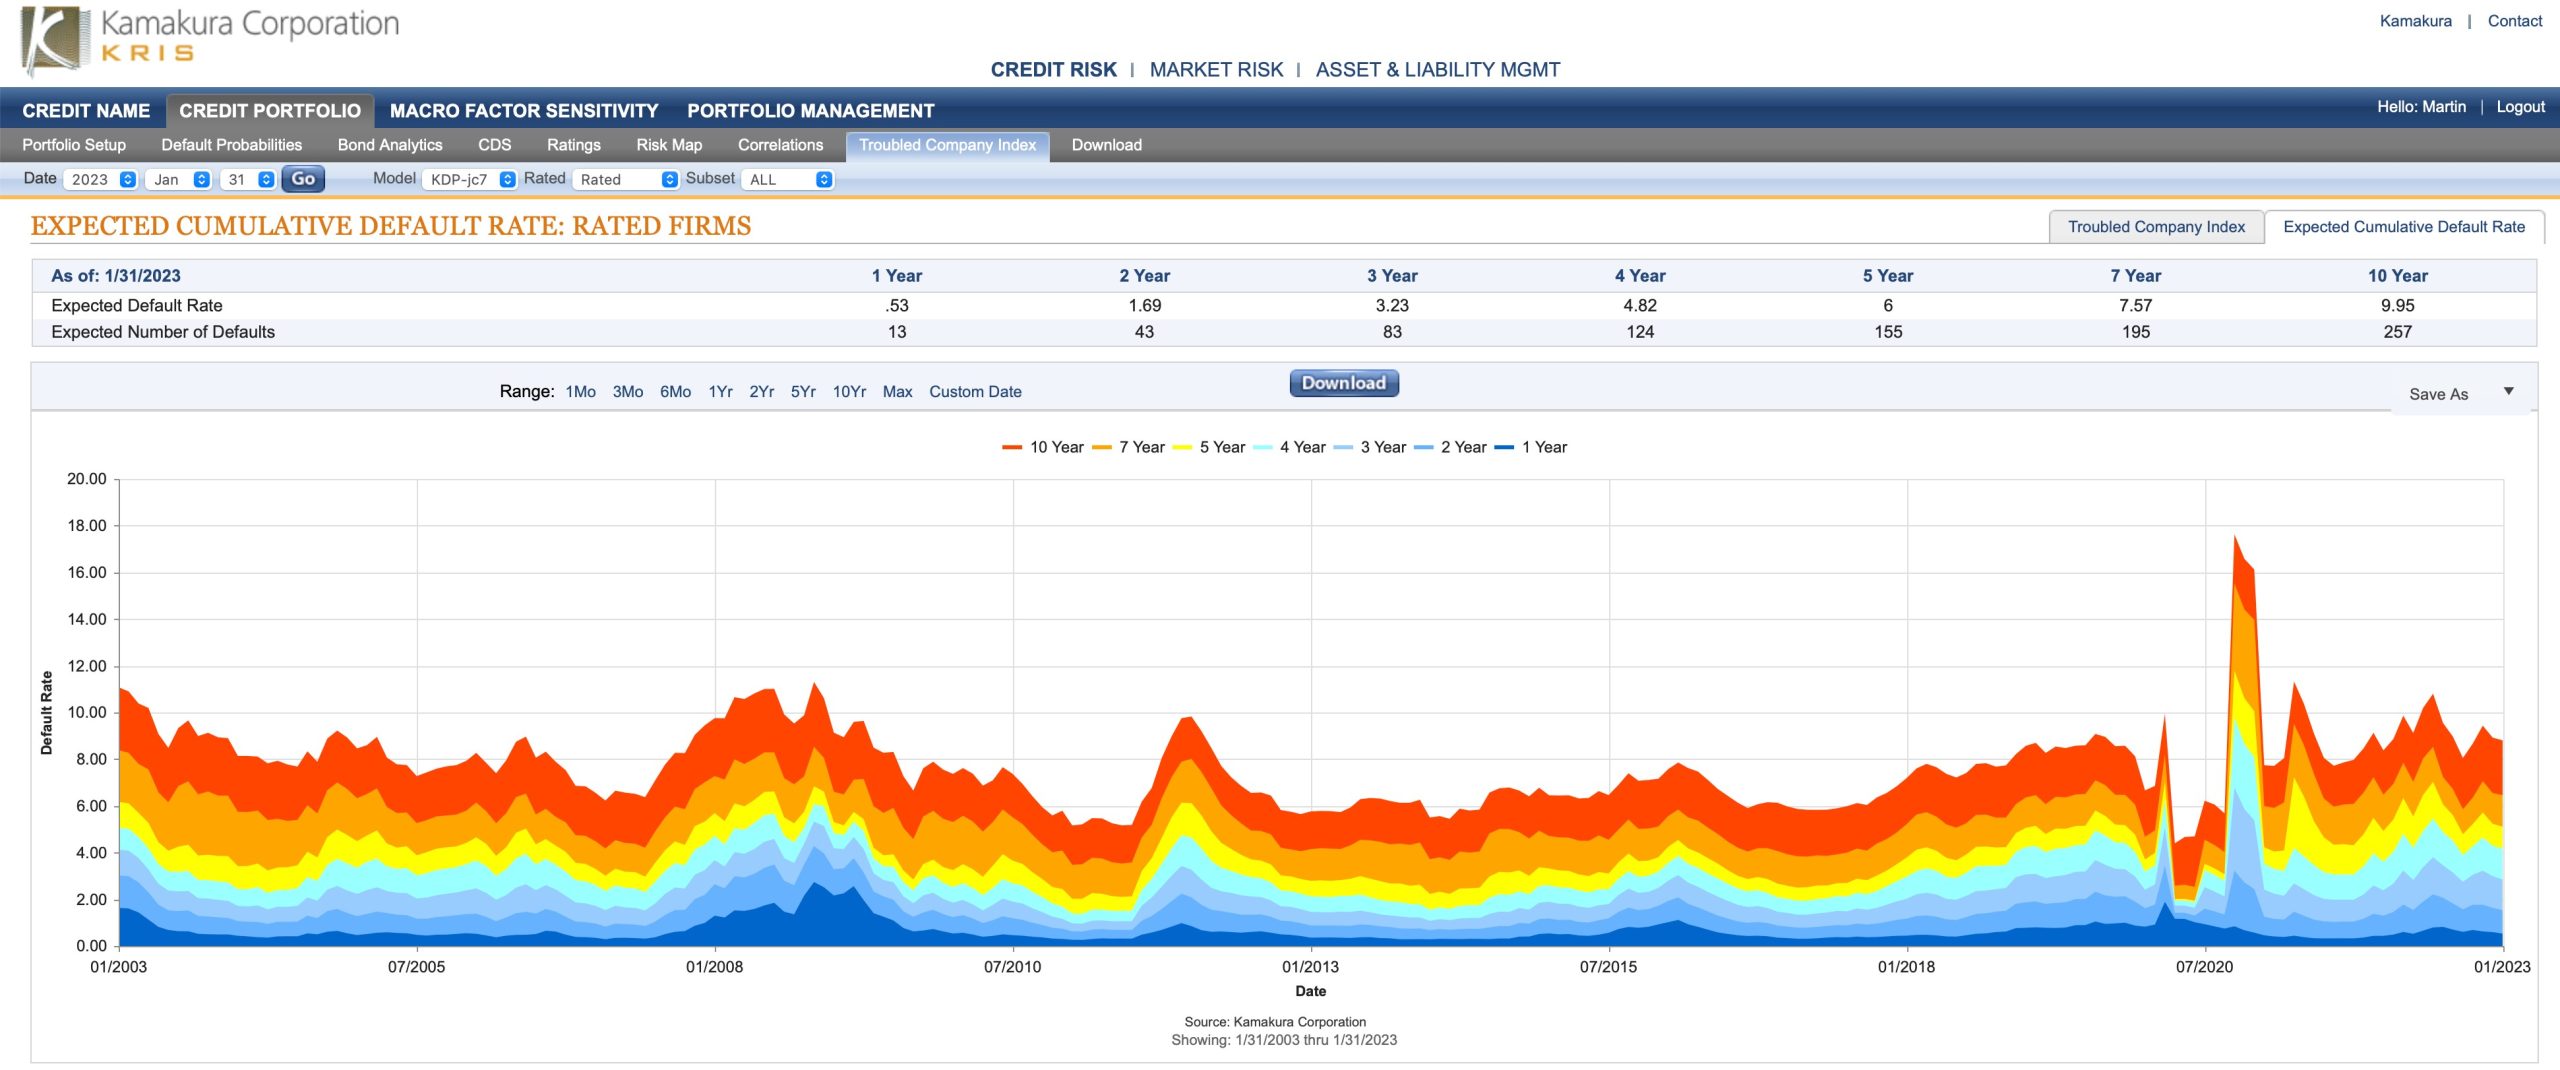
The Kamakura Expected Cumulative Default Rate, the only daily index of credit quality of rated firms worldwide, shows the one-year rate down 0.06% at 0.53%, but the 10-year rate was up 0.97% at 9.95%. The three-year expected cumulative default rate rose to 3.23% which implies an increasing rate of defaults over the next few years.
Figure 3: Expected Cumulative Default Rate — January 31, 2023
Commentary
Stas Melnikov and Martin Zorn
SAS Institute Inc.
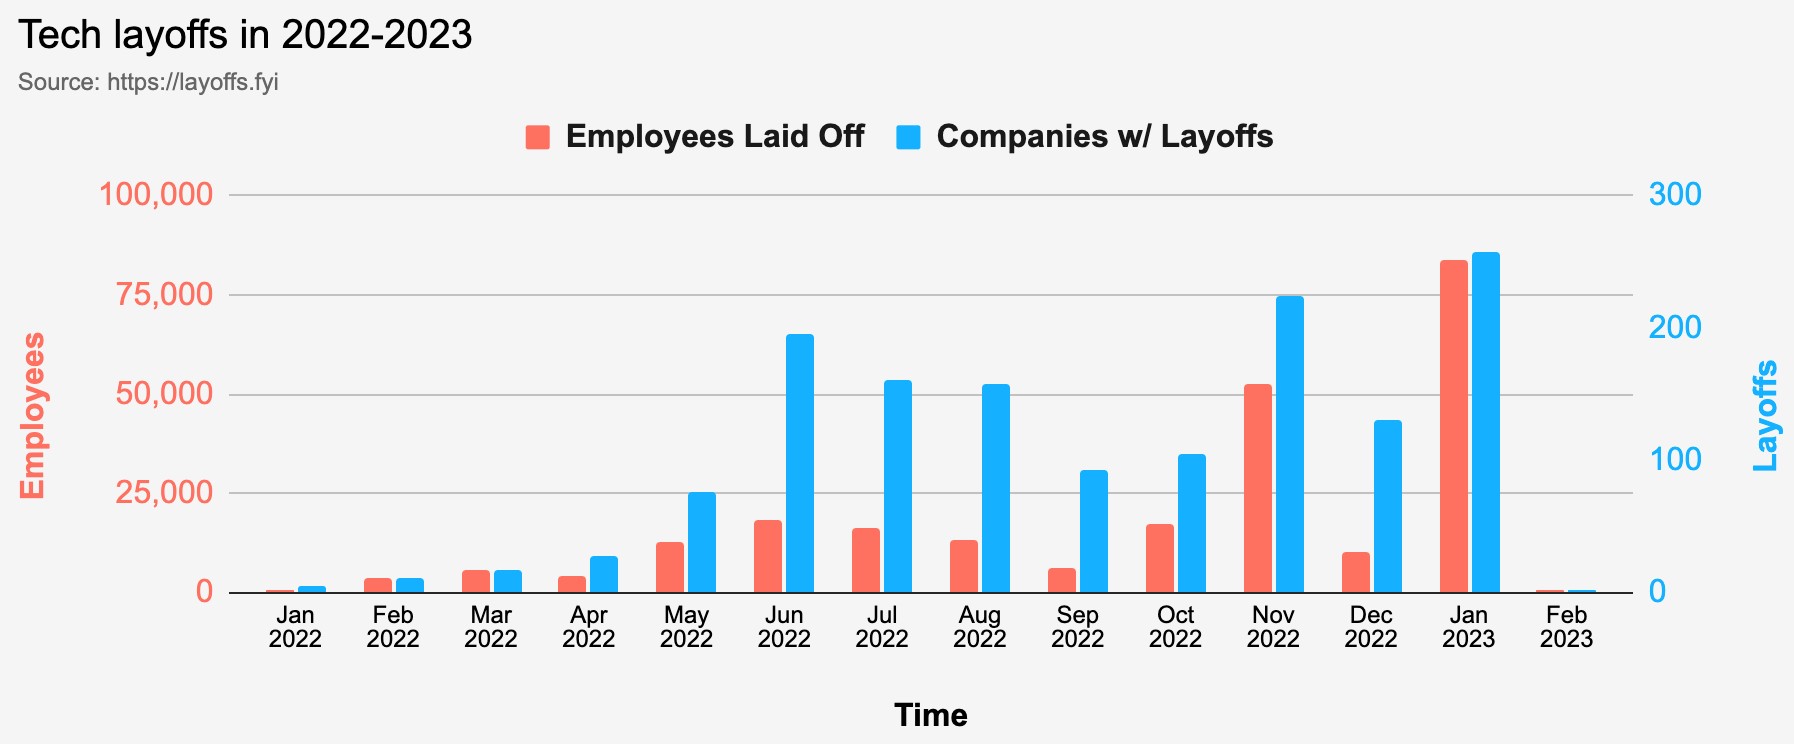
The markets ignored earnings and performed well in January. The Federal Reserve raised interest rates by a quarter-point to begin February and signaled plans to raise them by the same amount again next month. The bank acknowledged slower inflation but did not alter its guidance in the policy statement, which acknowledged that the job is not done. Later in the day, the monthly report from the Institute for Supply Chain Management (ISM) slipped further to 47.4 in January from 48.4 in December and 57.6 a year earlier. The index has fallen in 12 of the last 15 months to its lowest level since the first wave of the pandemic. Employment remains stronger than other components of the survey. Analysts speculate that we are seeing a “hoarding of labor” despite economic conditions, due to the well-publicized problem of attracting new employees and the prevailing narrative of the likely “soft landing”. Nevertheless, layoffs in the tech sector continue to accelerate as January saw more employees laid off than all Q4’22. As these are, on average, well compensated jobs with severance packages, the timing of the economic impact of this dislocation will likely be delayed.
Figure 4: Layoffs in Technology Sector Tracker
The environment is indeed an interesting one. Sales of existing homes in the U.S. fell to their lowest level since 2014, with mortgage rates remaining high compared to recent history. Consumer spending was spurred by government stimulus, savings accounts and cheap credit. Even as prices rose, consumers were intent on spending, with growth exceeding price increases by 2 percentage points.
The personal savings rate has now dipped below the level it held before the Covid-induced recession and the first round of stimulus checks. Though employment numbers have continued to trend at a half-century low, the public announcement of layoffs at large companies undoubtedly will have a psychological effect on consumers, even if it is not yet reflected in unemployment numbers. The Labor Department reported that 10.5 million jobs remained unfilled, yet signs of labor weakness are emerging. Employers are shedding temporary workers at a fast clip. People who lose their jobs are taking longer to find new ones, and the number of hours worked per week has declined for two straight months. The stress is starting to manifest in the consumer credit space, as delinquencies on credit cards and auto loans increased sharply in Q4’22 (although still remain at relatively low absolute levels). Propagation of these trends to the corporate credit is a matter of time and balance sheet resiliency.
All of these factors provide a reason to take a more forward-looking view of commercial default risks. They also show why the term structure of defaults and the expected cumulative default data are so meaningful. You can only identify inflection points after they have occurred, but portfolio managers must be nimble, structuring their portfolios for what will happen, not what has happened.
SAS is well-positioned to provide all the analytics necessary for answering the myriad of questions posed by the challenges we face today.
About the Troubled Company Index
The Kamakura Troubled Company Index® measures the percentage of 41,500 public firms in 76 countries that have an annualized one-month default risk of over one percent. The average index value since January 1990 is 14.35%. Since July 2022, the Kamakura index has used the annualized one-month default probability produced by the KRIS version 7.0 Jarrow-Chava reduced form default probability model, a formula that bases default predictions on a sophisticated combination of financial ratios, stock price history, and macro-economic factors.
The KRIS version 7.0 models were developed using a data base of more than 4 million observations and more than 4,000 corporate failures. A complete technical guide, including full model test results and key parameters, is provided to subscribers. The KRIS service also includes a wide array of other default probability models that can be seamlessly loaded into Kamakura’s state-of-the-art enterprise risk management software engine, Kamakura Risk Manager. Available models include the non-public-firm default model, the U.S. bank model, and the sovereign model. Related data includes market-implied credit spreads and prices on all traded corporate bonds traded in the U.S. market. Macro factor parameter subscriptions include Heath, Jarrow, and Morton term structure models for government securities yields in Australia, Canada, France, Germany, Italy, Japan, Russia, Singapore, Spain, Sweden, Thailand, the United Kingdom, and the United States, plus a 13-country “World” model. All parameters are derived in a no-arbitrage manner consistent with seminal papers by Heath, Jarrow, and Morton, as well as Amin and Jarrow.
The version 7.0 model was estimated over the period from 1990, through the Great Recession and ending in February 2022. The 76 countries currently covered by the index are Argentina, Australia, Austria, Bahrain, Bangladesh, Belgium, Belize, Botswana, Brazil, Bulgaria, Canada, Chile, China, Colombia, Croatia, Cyprus, Czech Republic, Denmark, Egypt, Estonia, Finland, France, Germany, Ghana, Greece, Hungary, Hong Kong, Iceland, India, Indonesia, Ireland, Israel, Italy, Japan, Jordan, Kenya, Kuwait, Luxembourg, Malaysia, Malta, Mauritius, Mexico, Nigeria, the Netherlands, New Zealand, Norway, Oman, Pakistan, Peru, the Philippines, Poland, Portugal, Qatar, Romania, Russia, Saudi Arabia, Serbia, Singapore, Slovakia, Slovenia, South Africa, South Korea, Spain, Sri Lanka, Sweden, Switzerland, Tanzania, Taiwan, Thailand, Turkey, the United Arab Emirates, Uganda, the UK, the U.S., Vietnam and Zimbabwe.
About SAS
SAS is the leader in analytics. Through innovative software and services, SAS empowers and inspires customers around the world to transform data into intelligence. SAS gives you THE POWER TO KNOW®.
Editorial contacts:
- Martin Zorn – Martin.Zorn@sas.com
- Stas Melnikov – Stas.Melnikov@sas.com