

NEW YORK: May 1, 2025: This week’s economic news shot across the globe like a bullet: “U.S. Economy Shrank as Imports Surged Ahead of Tariffs.” Indeed, tariffs on imports created the biggest drag on growth since 1947. The ensuing level of anxiety and uncertainty has completely overtaken the news cycle and is now having a strong impact on economic decisions. Normally–even in uncertain times– markets project an expectation for growth, earnings and inflation. But at this writing, at least 40 publicly-listed companies have pulled back or lowered their guidance for the year. Many are questioning whether the U.S. will retain its safe haven status. In the short run, volatility is allowing savvy traders to generate significant revenue, but that doesn’t amount to a viable long-term strategy (as Keynes quipped, in the long run, we will all be dead.) Investors must maintain a higher-level perspective, though granted, it can be difficult amid the extraordinary volume of signal and noise. Then again no one should have thought that efforts to reset global trading standards of the past 30 years would be smooth or predictable.
As events unfold, protecting against downside risk has become more important than ever. A useful tool is our 3-Year Median Default Probability by Sector analysis (Table 1), which clearly identifies the risks in the key consumer discretionary and energy sectors since the start of the year.
A knee-jerk reaction would be to expect multiples on equities to contract and spreads on debt to increase, as well as anticipating a movement to government bonds or gold as a risk-off strategy. But that view is likely overly simplistic. The search for individual havens from the storm should focus on a longer-term view, recognizing that while prediction in the near term is very difficult, growth in demand for certain products and services will exist regardless of tariffs or trade agreements. Sound business practices can serve as another bulwark. Companies that had strong management teams in place before tariff uncertainties still have strong management teams (and of course, the opposite is true as well). Fundamentals are clearly more critical than trying to predict short-term movement. Let the traders focus on day-to-day signal and noise. As investors, we are playing a long game and must remember to stick to a three-to-five-year horizon.
Table 1: Change in 3-Year Median Default Probability by Sector – December 31, 2024 – April 28, 2025
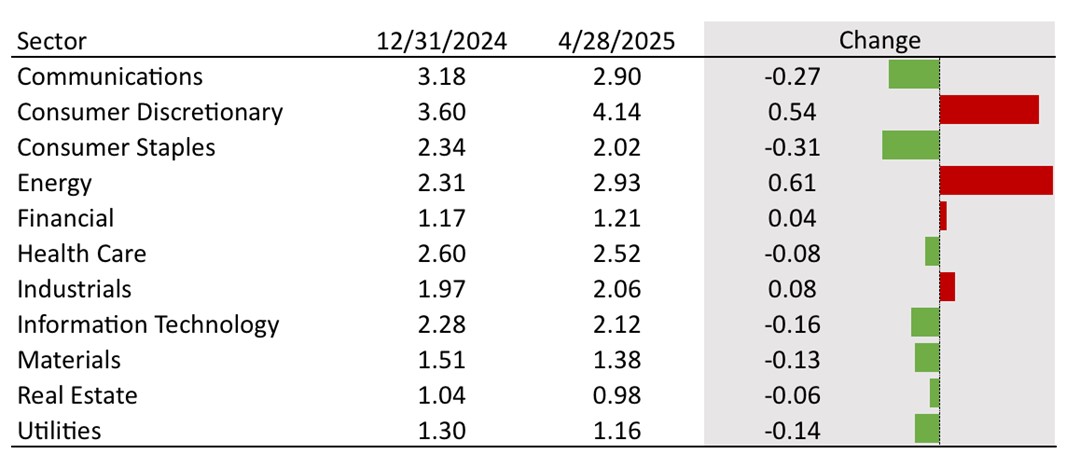
Source: SAS Institute KRIS data service
With that perspective in mind, we will take a more in-depth look at the transportation segment, which is part the larger industrials segment. More specifically, we have created a list of U.S. transport and logistics firms specifically tied to the movement of freight and goods. This includes shipping, air cargo, trucking, rail, and logistics firms. As these companies tried to front-run the tariffs and increased imports, we realized it was critical to take a longer view and focus on their 3-year default probabilities. If domestic manufacturing increases or consumers forgo imported goods, you would expect ocean shipping volumes to decline significantly, while domestic shipping–via rail or truck– may remain stable. On the other hand, general price increases or reductions in consumer spending could cause all shipping to fall. Until we see the details of bilateral trade agreements, it is difficult to run effective scenario analyses, which require us to use more multi-factor simulations and hedging.
In Table 2, we can see that the increase in the 3-year default probability for the freight transportation subsector increased considerably more than it did for most entire sectors. But we also see that the relative default rate is still low. This is likely because many of the firms in this index are financially strong. Nevertheless, there are a number with elevated default probabilities that should be examined more closely. If you would like the full list of firms identified in Figure 1 please contact us.
Table 2: Change in 3-Year Median Default Probability Freight and Goods Transporters – December 31, 2024 – April 28, 2025

Figure 1 – The Riskiest 20% of the Freight and Goods Transporters as Measured by the Three-Year Default Probability.

The ability to analyze data on an absolute and relative basis as and create relevant portfolios is always important. But in the current environment of elevated uncertainty, doing so is absolutely critical.
Contemporaneous Credit Conditions
The Kamakura Troubled Company Index® closed the month at 9.03%, up 0.51% from the prior month. The index measures the percentage of 42,500 public firms worldwide with an annualized one-month default probability of over 1%. An increase in the index reflects declining credit quality, while a decrease reflects improving credit quality.
At the end of April, the percentage of companies with a default probability between 1% and 5% was 6.58%. The percentage with a default probability between 5% and 10% was 1.25%. Those with a default probability between 10% and 20% amounted to 0.85% of the total; and those with a default probability of over 20% amounted to 0.35%. For the month, short-term default probabilities ranged from a low of 8.64% on April 1 to a high of 11.34% on April 8.
Figure 2: Troubled Company Index®, April 30, 2025

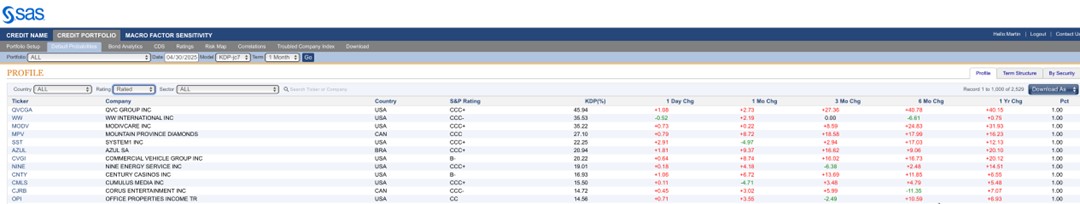
At the end of April, the riskiest 1% of rated public firms within the coverage universe as measured by 1-month default probability included nine companies in the U.S., two in Canada and one in France. QVC Group, Inc (NASDAQ:QVCGA) remained the riskiest rated firm in our universe, with a 1-month KDP of 45.94%–up 2.73% over the past month.
Table 3: Riskiest Rated Companies Based on 1-month KDP, April 30, 2025
The Expected Cumulative Default Rate, the only daily index of credit quality of rated firms worldwide, shows the one-year rate of 0.64% up 0.11% from the prior month, with the 10-year rate down 0.71% at 8.12%.
Figure 3: Expected Cumulative Default Rates, April 30, 2025

About the Troubled Company Index
The Kamakura Troubled Company Index® measures the percentage of 42,500 public firms in 76 countries that have an annualized one-month default risk of over one percent. The average index value since January 1990 is 14.00%. Since July 2022, the index has used the annualized one-month default probability produced by the KRIS version 7.0 Jarrow-Chava reduced form default probability model, a formula that bases default predictions on a sophisticated combination of financial ratios, stock price history, and macro-economic factors.
The KRIS version 7.0 models were developed using a data base of more than 4 million observations and more than 4,000 corporate failures. A complete technical guide, including full model test results and key parameters, is provided to subscribers. Available models include the non-public-firm default model, the U.S. bank model, and the sovereign model.
The version 7.0 model was estimated over the period from 1990, through the Great Recession and ending in February 2022. The 76 countries currently covered by the index are Argentina, Australia, Austria, Bahrain, Bangladesh, Belgium, Belize, Botswana, Brazil, Bulgaria, Canada, Chile, China, Colombia, Croatia, Cyprus, Czech Republic, Denmark, Egypt, Estonia, Finland, France, Germany, Ghana, Greece, Hungary, Hong Kong, Iceland, India, Indonesia, Ireland, Israel, Italy, Japan, Jordan, Kenya, Kuwait, Luxembourg, Malaysia, Malta, Mauritius, Mexico, Nigeria, the Netherlands, New Zealand, Norway, Oman, Pakistan, Peru, the Philippines, Poland, Portugal, Qatar, Romania, Russia, Saudi Arabia, Serbia, Singapore, Slovakia, Slovenia, South Africa, South Korea, Spain, Sri Lanka, Sweden, Switzerland, Tanzania, Taiwan, Thailand, Turkey, the United Arab Emirates, Uganda, the UK, the U.S., Vietnam and Zimbabwe.
About SAS
SAS is the leader in analytics. Through innovative software and services, SAS empowers and inspires customers around the world to transform data into intelligence. SAS gives you THE POWER TO KNOW®.
Editorial contacts:
- Martin Zorn – Martin.Zorn@sas.com
- Stas Melnikov – Stas.Melnikov@sas.com