

The AI infrastructure buildout is a credit theme that extends beyond the technology sector. Computing capacity depends on advanced semiconductors and servers, along with data centers, electrical equipment, cooling systems, fiber networks, construction services and power generation. Financing that investment connects the operating ecosystem to banks, bondholders, infrastructure investors and private credit providers.
At this stage of the cycle, there is no doubt that AI adoption will continue to grow. For creditors, the issue is whether revenue and cash generation will arrive soon enough to meet the financial obligations incurred across the supporting ecosystem.
To monitor these developments, we are introducing an AI Infrastructure Credit Risk Dashboard and AI Credit Pulse Index, combining a purpose-built company taxonomy with proprietary default probabilities from KRIS® Risk Data and Analytics from SAS. The objective is to establish a consistent view of the ecosystem’s financial health and a reference point against which future changes can be evaluated.
Why AI infrastructure matters for the broader credit market
The scale of investment makes this a theme worth monitoring across credit portfolios. In its 2026 assessment, the International Energy Agency reported that capital expenditure by the largest technology companies exceeded $400 billion in 2025, with a further increase of approximately 75% expected in 2026. These figures represent total capital expenditure by the companies concerned, rather than a measure of AI-only spending, but they illustrate the financial scale surrounding the infrastructure expansion. [1]
The implications reach into industries with very different operating and financing models. The IEA projects that global electricity consumption by data centers will roughly double from 485 terawatt-hours in 2025 to 950 terawatt-hours in 2030. Although these figures cover all data centers, AI-focused facilities are an important source of the projected growth. The associated investment therefore extends from computing equipment into generation, transmission, electrical distribution and cooling.
From a credit perspective, this creates both opportunities and obligations. Sustained demand can improve supplier utilization and support recurring revenue. The risk is timing: companies may make substantial cash outlays well before new capacity generates revenue. The balance between those benefits and commitments depends on each company’s business model, customer relationships, capital structure and execution capabilities.
A portfolio can consequently hold exposure to the same investment cycle through several apparently distinct sectors. A cloud provider, its hosting partner, an electrical contractor and an equipment manufacturer may all depend on related investment decisions or counterparties. Conventional sector classifications remain useful, but an additional thematic view helps identify these economic connections.
That is the rationale for introducing the dashboard: to monitor a shared investment theme without assuming that all participating companies have the same exposure or credit characteristics.
Establishing a taxonomy: mapping the ecosystem by economic role
We created a taxonomy that groups companies by their economic role in the AI infrastructure buildout. The initial research universe comprises 163 companies across 15 categories, with global coverage excluding China and including Taiwan. Its focus is the U.S.-centric AI infrastructure buildout, but participation is determined by economic relevance rather than the location of a company’s stock-market listing.
Nokia provides a good example of the need for carefully crafted taxonomy. Its selection to supply CoreWeave with IP routing and optical transport infrastructure for deployment across U.S. and European data centers creates a direct connection to the buildout. Within the taxonomy, Nokia belongs with networking equipment suppliers and not with companies that own fiber networks and sell transport services. Those activities participate in the same ecosystem but transmit credit risk through different business models. [2]
Figure 1: AI Ecosystem Taxonomy
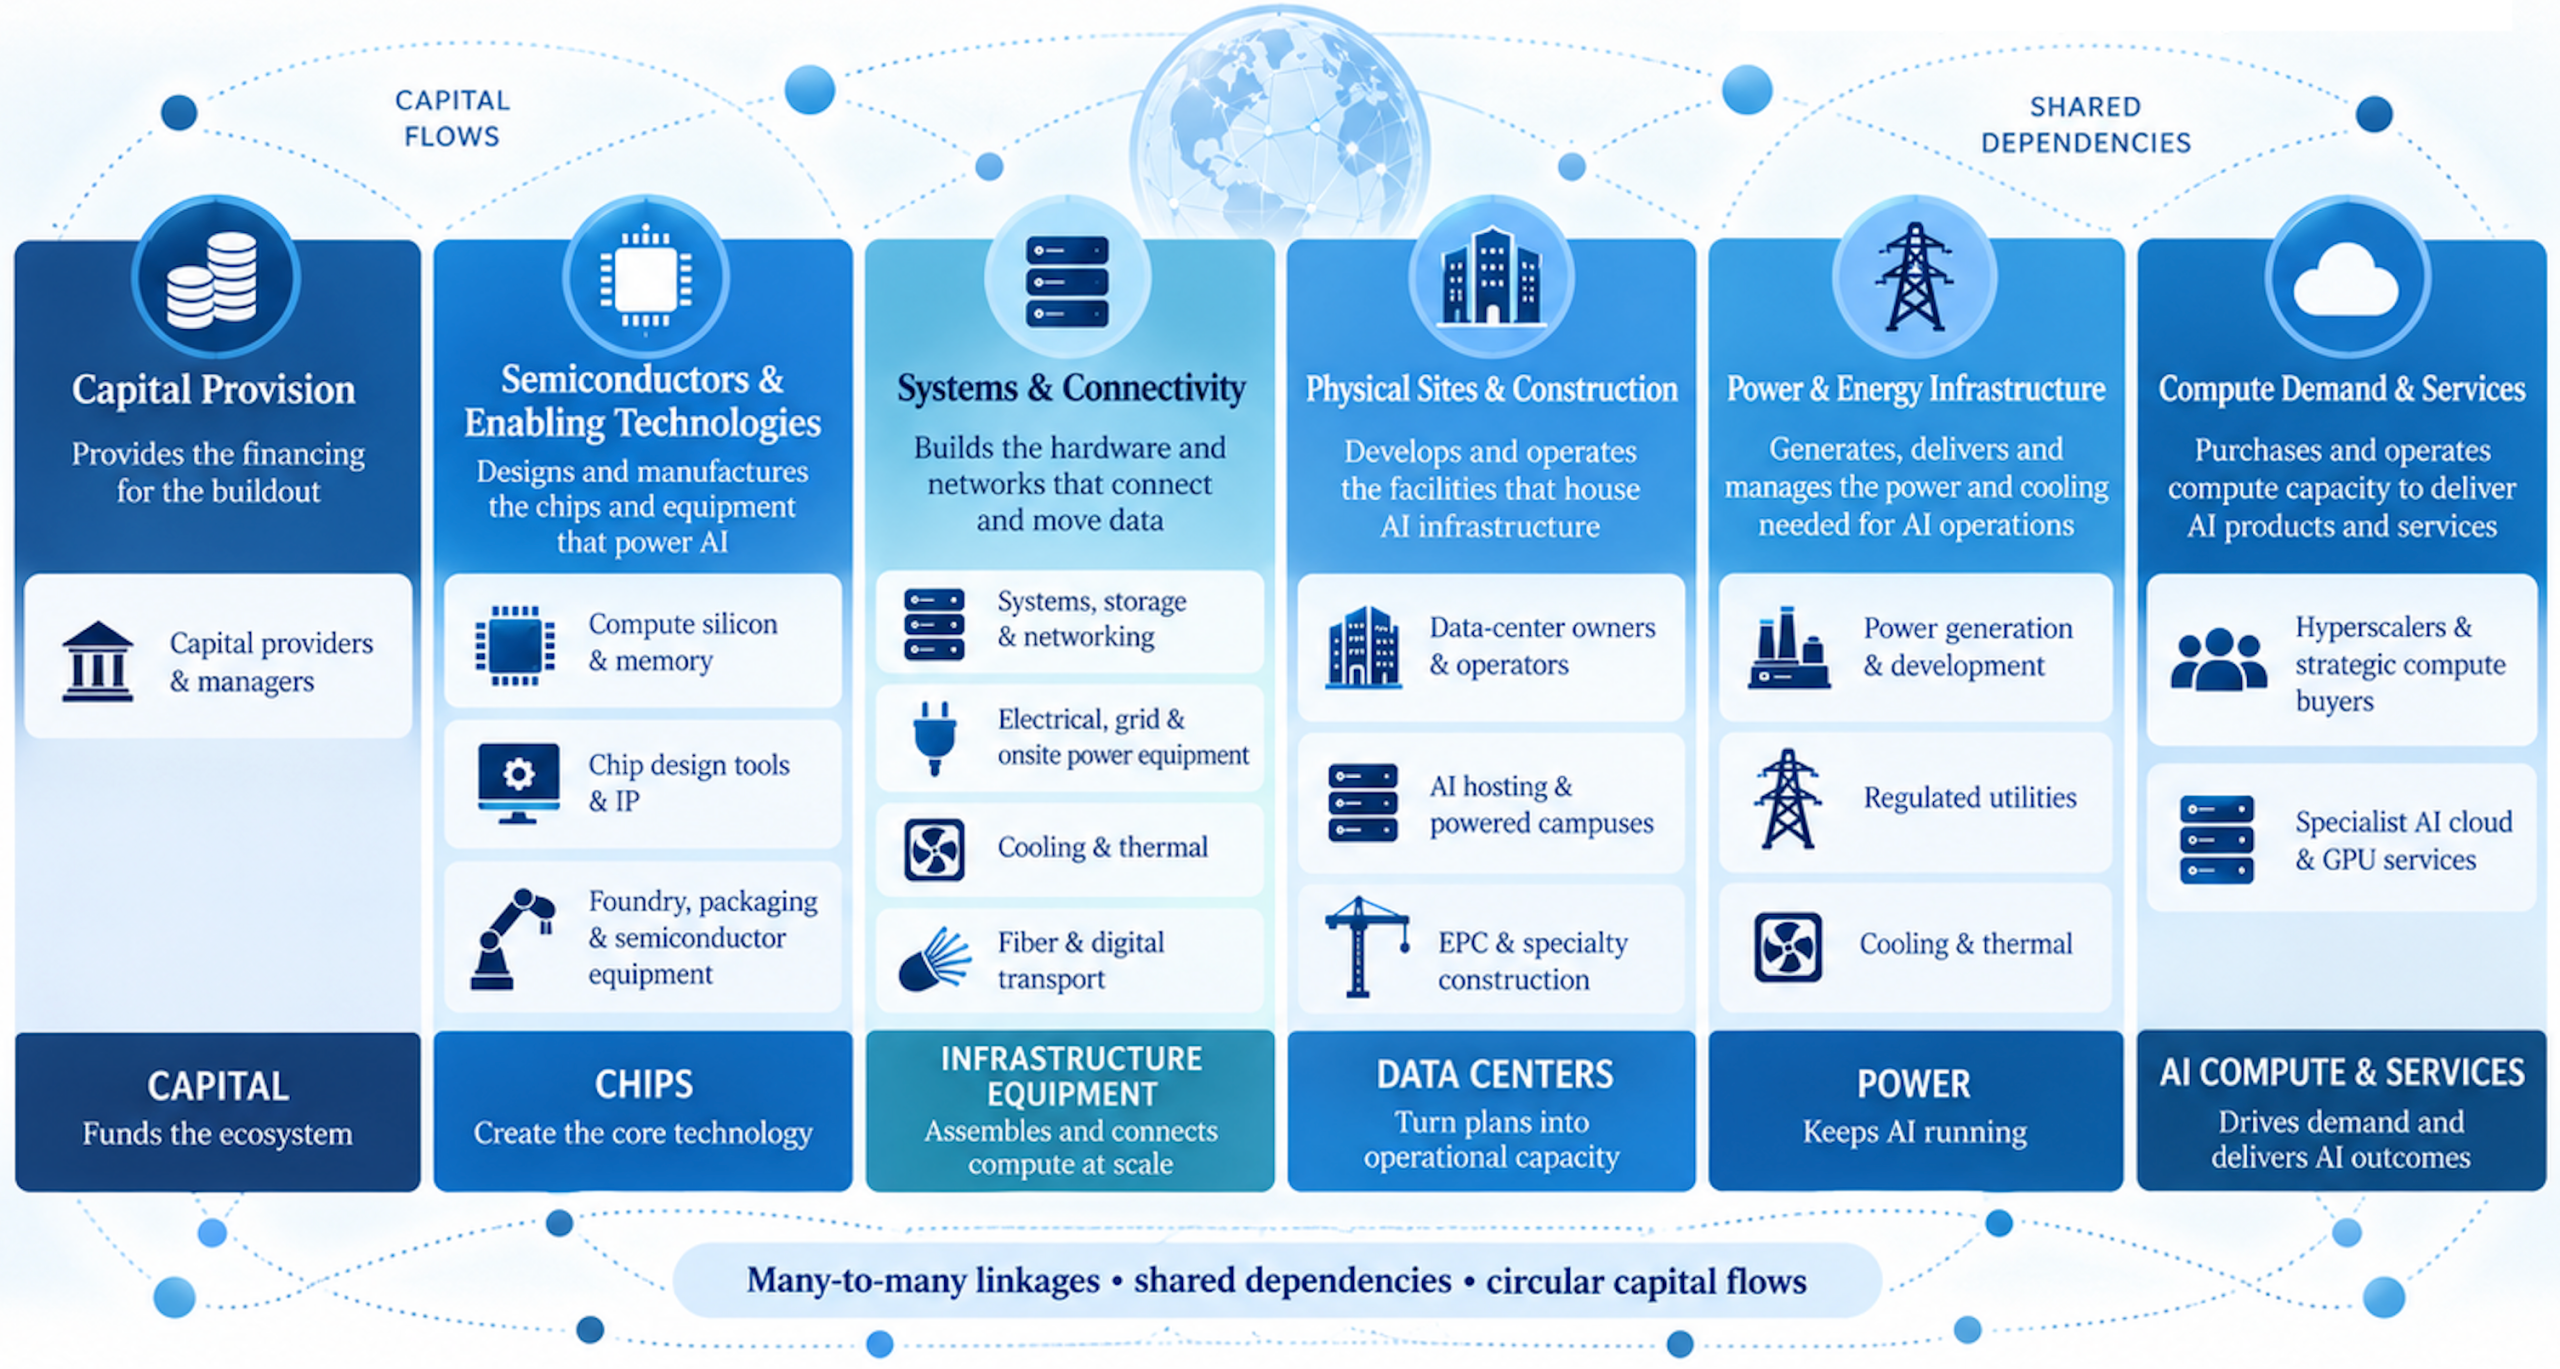
The taxonomy follows six broad parts of the investment chain, divided into the 15 categories shown in the dashboard.
Compute demand and service provision. Hyperscalers and strategic compute buyers are separated from specialist AI-cloud and GPU-service providers. This separates diversified buyers and operators of computing capacity from companies that primarily sell specialized computing services.
Power and thermal infrastructure. Power generation and development, regulated utilities, electrical and onsite-power equipment, and cooling and thermal systems cover the infrastructure needed to energize and support the computing estate. The categories separate asset owners, regulated utilities and equipment manufacturers because their financing and risk profiles differ.
Physical sites and construction. Data-center owners and operators, AI hosting and powered campuses, and engineering, procurement and construction—including specialty contractors—capture the development and operation of the physical estate. The distinction between operating assets and projects still under construction is particularly important for interpreting financial commitments.
Systems and connectivity. Systems, storage and networking cover the equipment and manufacturing capabilities needed to assemble and connect computing infrastructure. Fiber and digital transport are treated separately because ownership and operation of a network differ from manufacturing the equipment used within it.
Semiconductors and their enabling technologies. Compute silicon and memory, chip-design tools and intellectual property, and foundry, packaging and semiconductor equipment capture the chain from design through manufacturing. Subsegments distinguish businesses whose economics depend on licensing, equipment orders, production utilization or semiconductor product cycles.
Capital provision. Capital providers and managers form a separate category. Their presence helps trace the financing ecosystem, while recognizing that the credit risk of a listed manager is not interchangeable with that of its funds, portfolio companies or project-financing vehicles.
Each company has one primary category: this supports issuer-level aggregation without counting the same company multiple times across functional views.
The universe is a selected monitoring population, not a claim to include every company affected by AI. Nor is it restricted to pure-play AI businesses. For diversified companies, the taxonomy identifies the relevant economic connection; it does not imply that AI accounts for all, or necessarily most, of the issuer’s financial performance.
AI Infrastructure Credit Risk Dashboard
The dashboard’s analytical foundation is the probability of default (PD). KRIS provides daily updated credit signals, including PD term structures, using a modeling framework that combines company financial information, market data and macroeconomic indicators. This provides a consistent basis for monitoring public-company credit conditions across industries and countries.
The introductory snapshot (Table 1) focuses on one year PD: the modeled probability that an issuer will default over the following twelve months. Values are expressed in basis points, where 100 basis points equals 1%. A PD of 9 basis points therefore corresponds to a modeled one-year default probability of 0.09%.
Table 1: AI Infrastructure Credit Risk Dashboard (KRIS 1Yr PDs in bps)
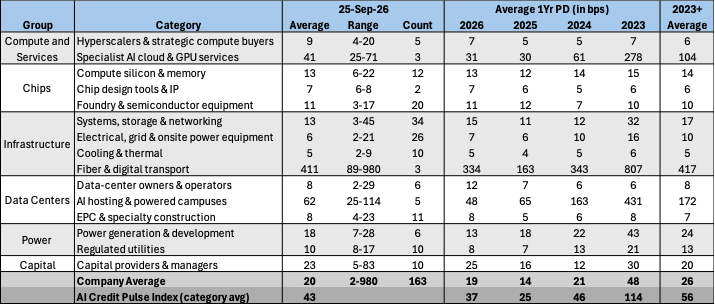
The dashboard presents category averages alongside the minimum, maximum and number of covered companies. Historical averages provide context for distinguishing a category’s current position from its earlier risk profile.
It is important to distinguish between the taxonomy and the PD signal: the taxonomy identifies a company’s connection to the AI buildout; the PD measures the credit risk of the issuer as a whole. It is not the probability that an individual AI project will fail, and a change in an issuer’s PD cannot automatically be attributed to AI.
Used alongside fundamental analysis of financial statements, credit spreads, ratings and contractual information, the dashboard is intended to direct attention to changes that merit investigation. It provides a monitoring framework and is not a substitute for issuer- or transaction-level credit analysis.
AI Credit Pulse Index
We have created an index to summarize the level of AI-related credit risk in one metric. The calculation has two steps. First, compute average issuer PDs within each category. Then take the arithmetic average of the 15 category results. A higher reading indicates greater modeled default risk. A reading of 43 basis points equals 0.43% on the PD scale; the index is not rebased to 100.
The weighting method determines what the index represents. Market capitalization weights would concentrate the measure in the largest companies (i.e., chips and hyperscalers), while equal issuer weights would give more influence to the categories with more listed constituents. Category balancing gives each economic role a consistent weight. It does not imply that categories have equal debt, economic importance or loss potential. The index summarizes public issuer credit risk and is not the probability that the AI sector or a specific project will fail.
Figure 2: AI Credit Pulse Index
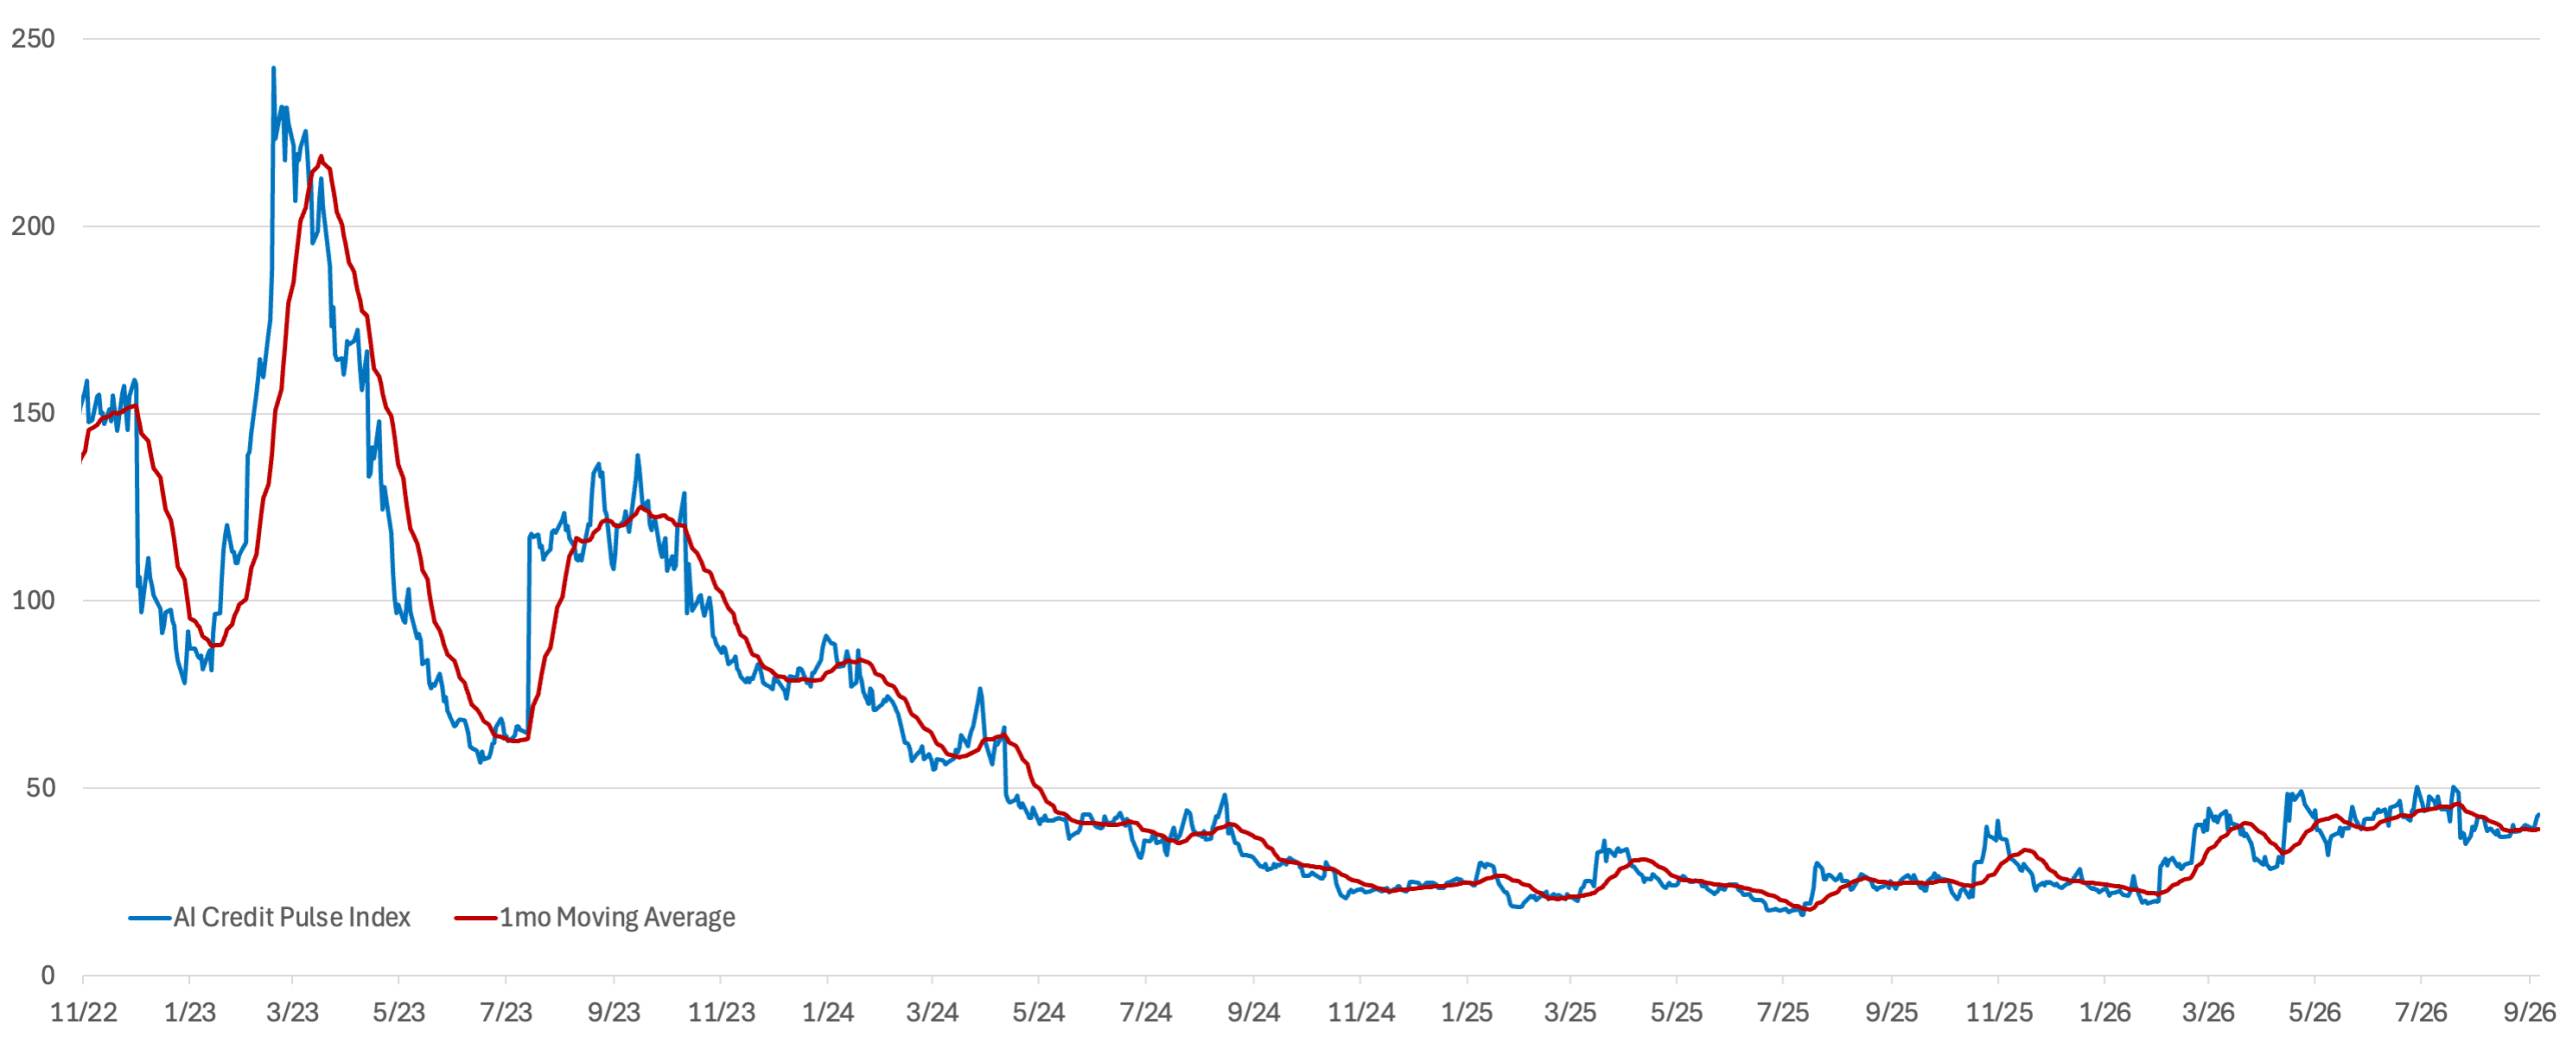
On September 25, 2026, the AI Credit Pulse Index was 43 basis points. The reported average was 37 for 2026 and 25 for 2025. The current reading was below both the displayed 2023-onward reference average of 56 and the 2023 average of 114; the reported 2024 average was 46.
Modeled default risk is currently low across much of the ecosystem. Eleven of the fifteen categories average 20 basis points or less. Compute silicon and memory is at 13; foundry, packaging and semiconductor equipment at 11; electrical equipment at 6; and cooling at 5. Each is at or below its 2026 average. Systems, storage and networking is also below its 2026 average, at 13 versus 15.
Building an early-warning framework before it is needed
The value of an early warning dashboard comes from maintaining a consistent observation framework through the investment cycle. Establishing the population and baseline now allows subsequent developments to be assessed against a defined starting point, rather than assembling a watchlist only after adverse events occur.
The category with the highest PD may not provide the earliest warning. More useful signals could include persistent deterioration in a previously stable group, a widening gap between related business models, or simultaneous deterioration across more issuers.
For example, specialist AI-cloud providers and campus developers are natural groups to monitor for changes associated with capacity utilization, customer commitments, construction and financing. Equipment suppliers and contractors provide a complementary view. Hyperscalers provide context on the financial health of major buyers, while utilities and power developers offer a view of the supporting infrastructure. Establishing whether one group consistently provides an earlier signal than another requires observation and testing over time.
We will update the dashboard regularly as credit conditions in the AI ecosystem change.
Current list of riskiest companies in the publicly traded AI universe
Table 2 below shows the 10 companies with the highest 1 year PD from the 163 companies included in the dashboard.
Table 2: Top 10 AI companies by 1 year PD
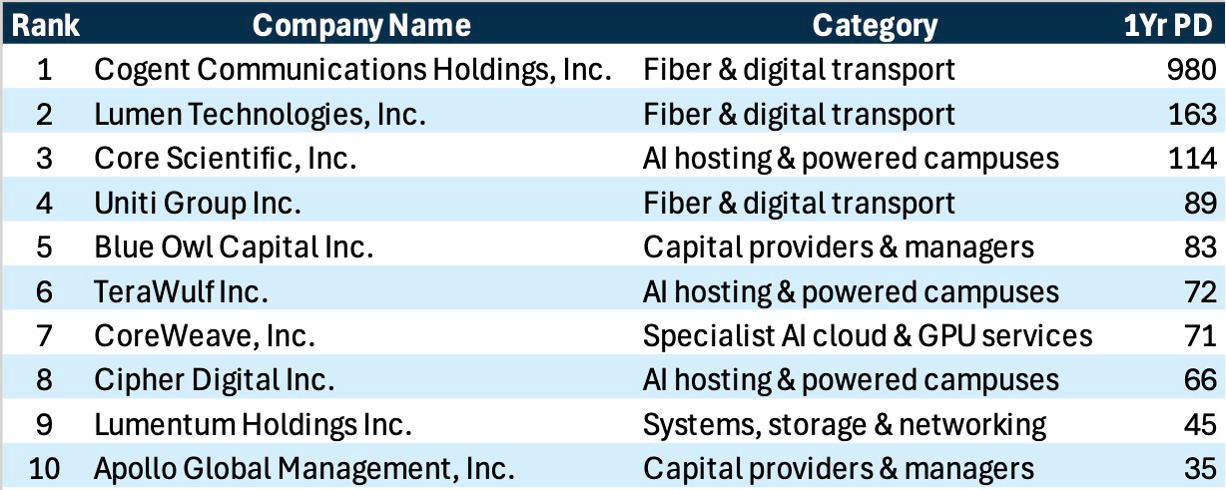
The top 10 do not point to a single source of stress across the AI ecosystem. They include legacy telecom businesses undergoing repositioning, specialist operators financing rapid capacity expansion, and financial intermediaries exposed to broader private-market conditions. Lumentum Holdings is a separate case: its results included a large noncash debt-extinguishment loss associated with the conversion of certain convertible notes into equity.
Reference sources
[1] International Energy Agency. Key Questions on Energy and AI, Executive summary. April 16, 2026. Capital-expenditure figures and data-center electricity-demand projections; forecasts are not realized spending or consumption. Source
[2] Nokia. Nokia selected by CoreWeave to provide networking backbone behind hyperscale AI cloud. September 16, 2024. Documented IP and optical-networking relationship across U.S. and European facilities. Source
Credit Conditions Summary – Top 3000 US Firms
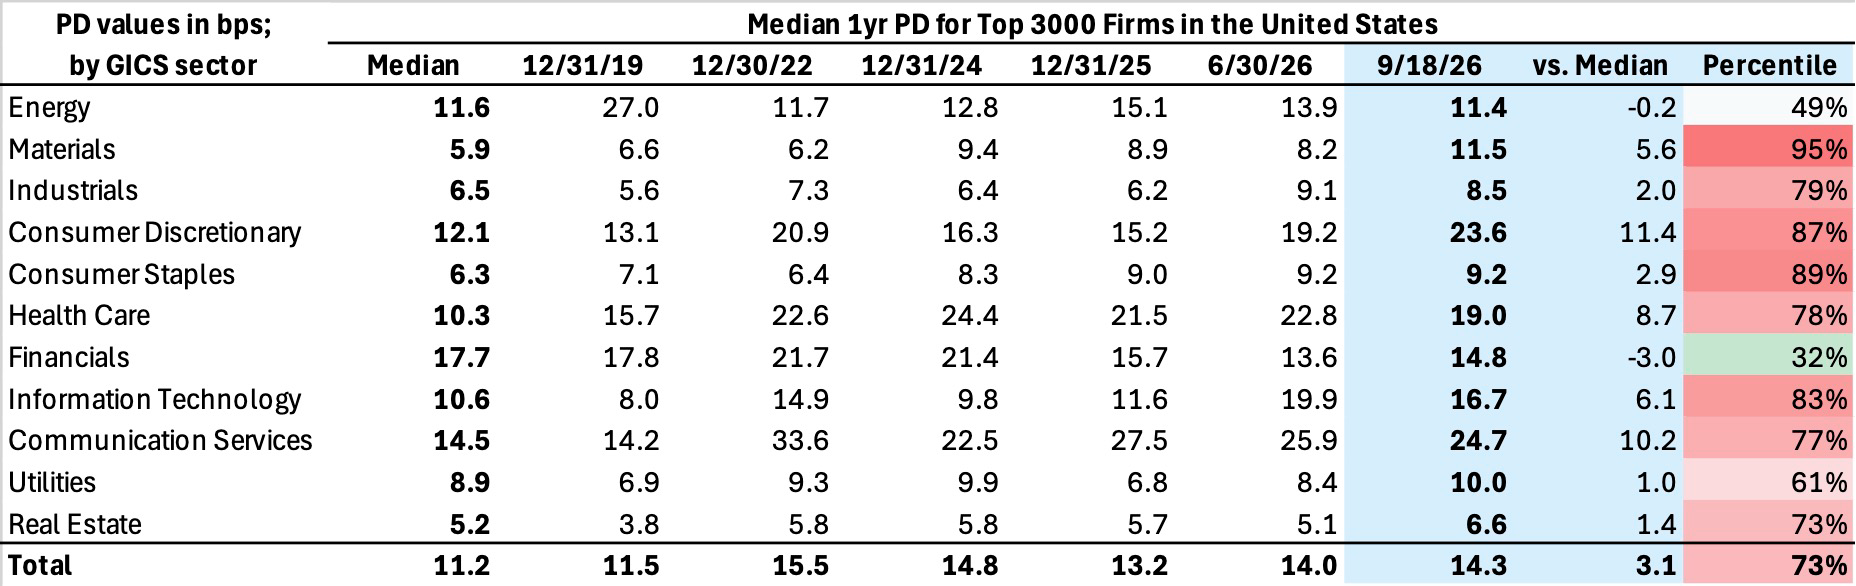
Conditions among the largest U.S. firms were consistent with the prior several months. The market-cap-weighted PD was flat, while the median deteriorated slightly. As a result, the gap between the two measures widened further, indicating that the largest firms continue to experience substantially lower credit risk than the typical company in the market.
Figure 3: Market Cap-Weighted Cumulative Default Probability – Top 3000 Companies in the US
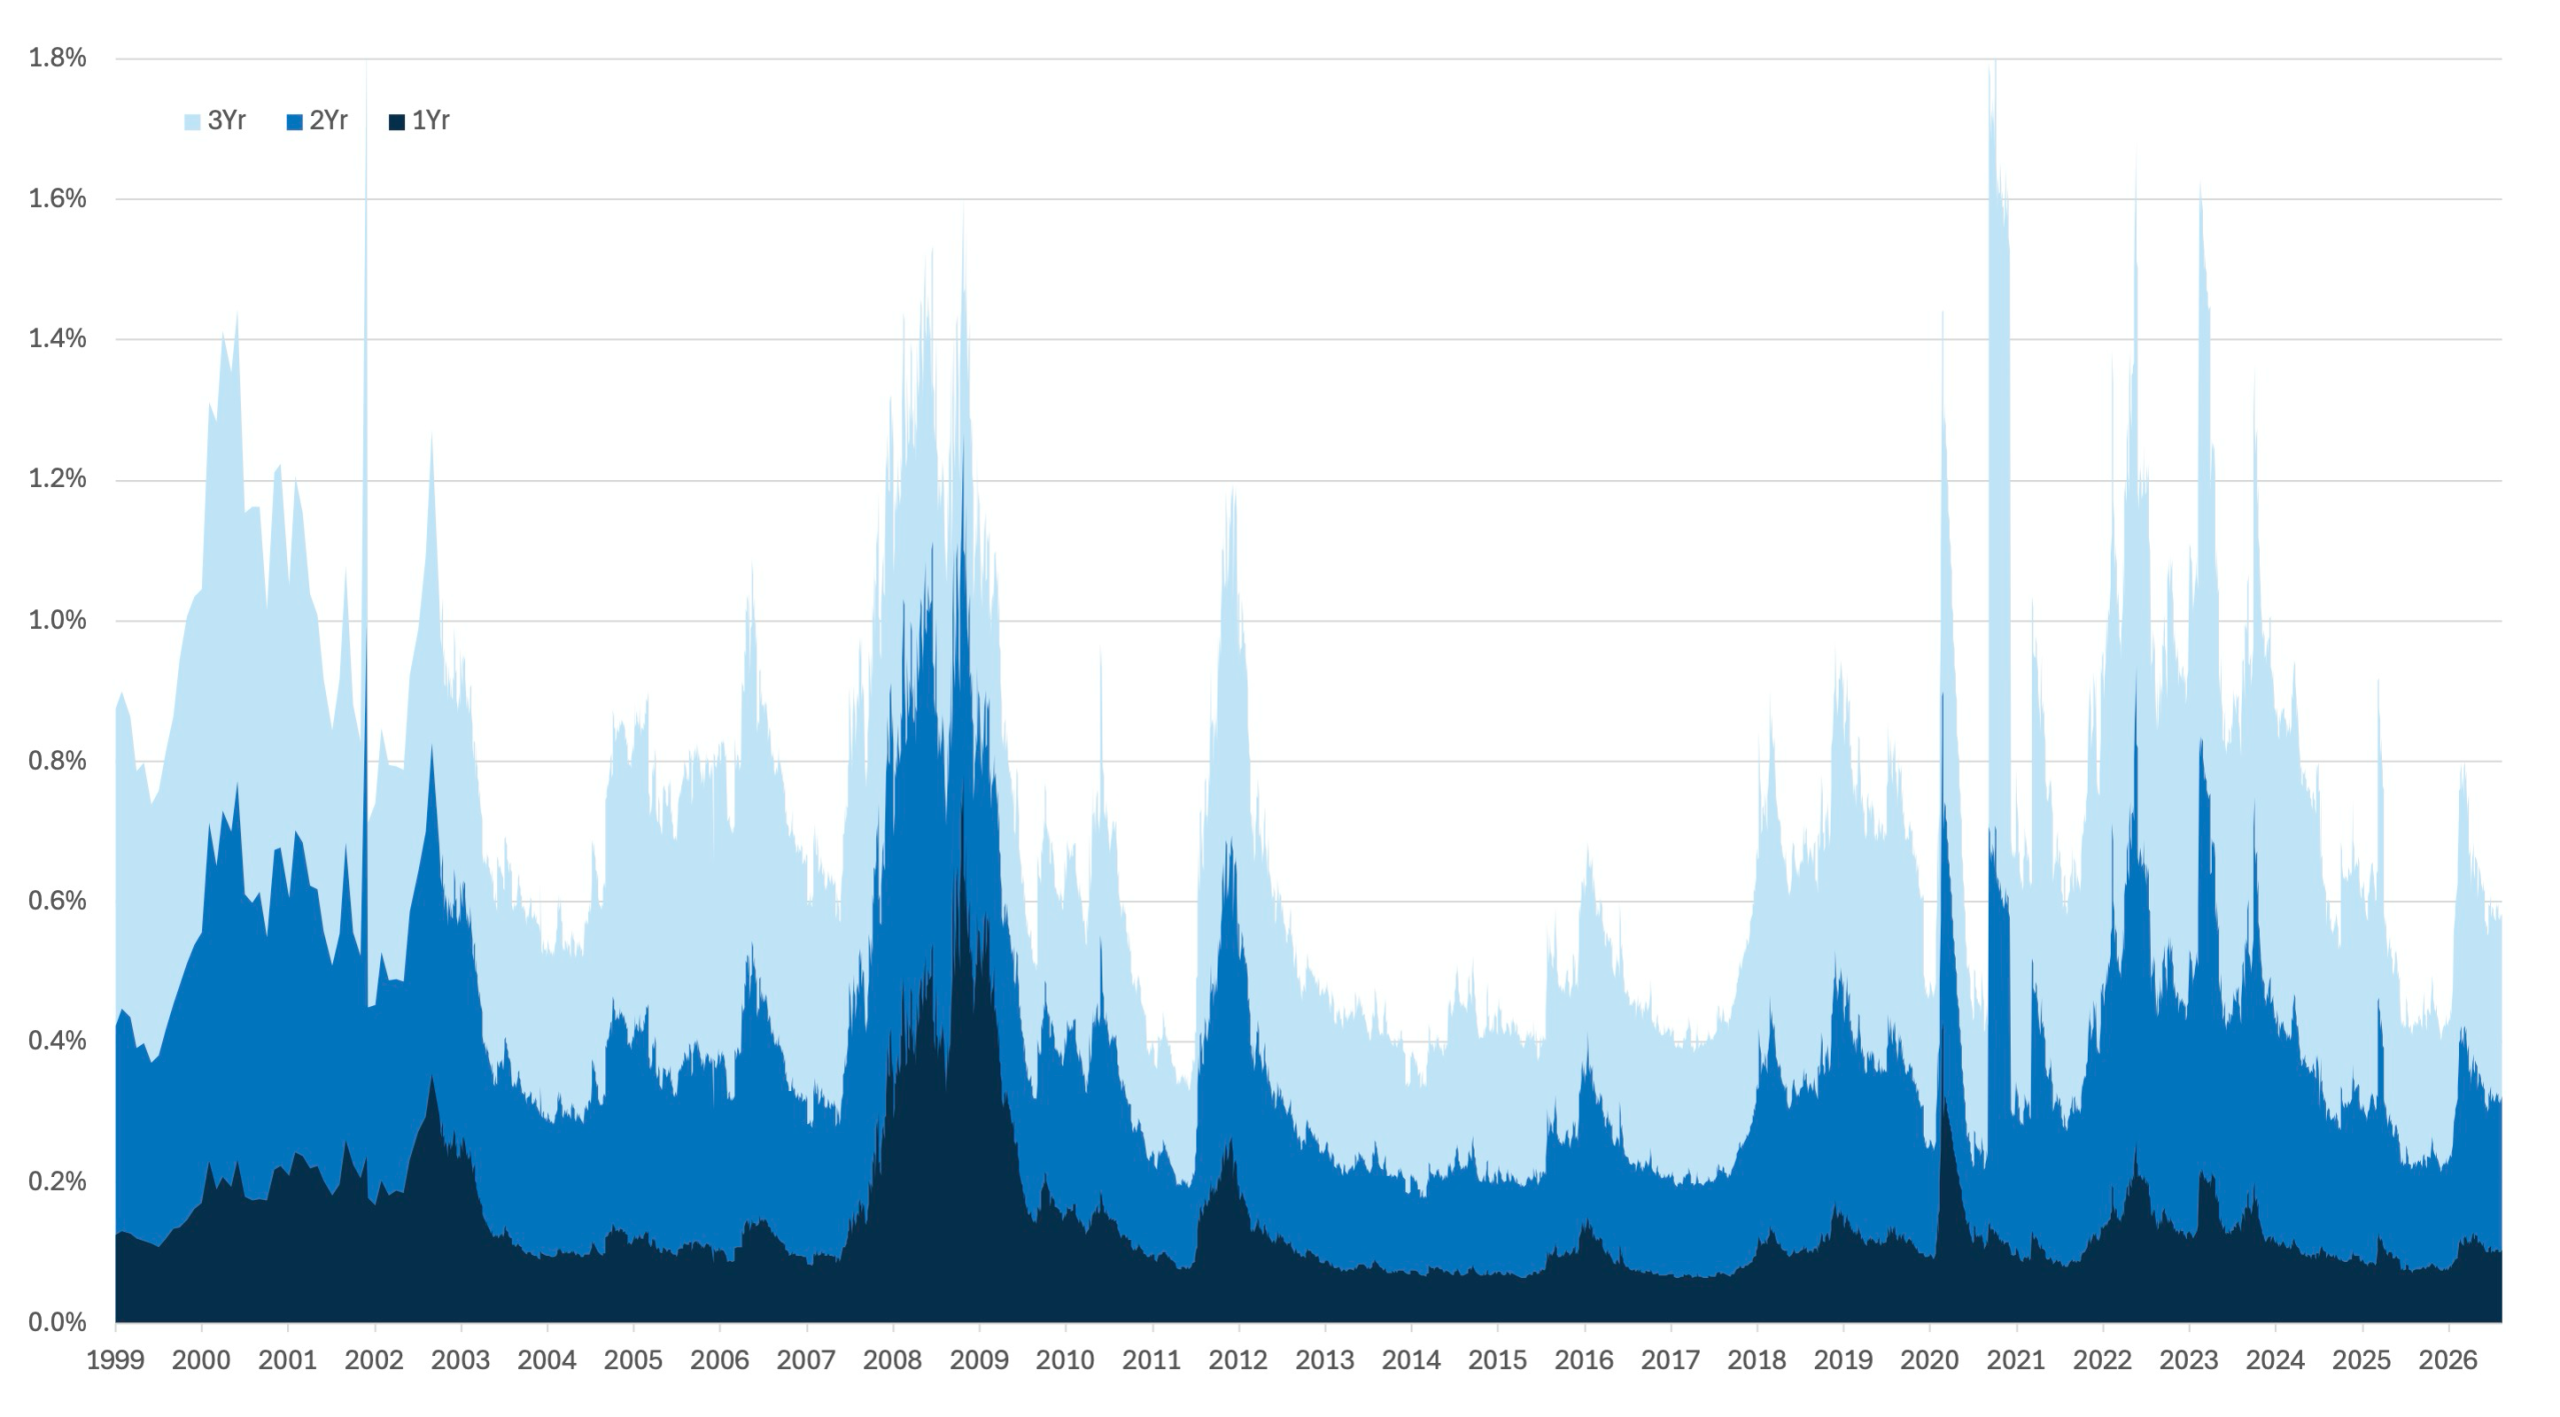
Figure 4: Median Cumulative Default Probability – Top 3000 Companies in the United States
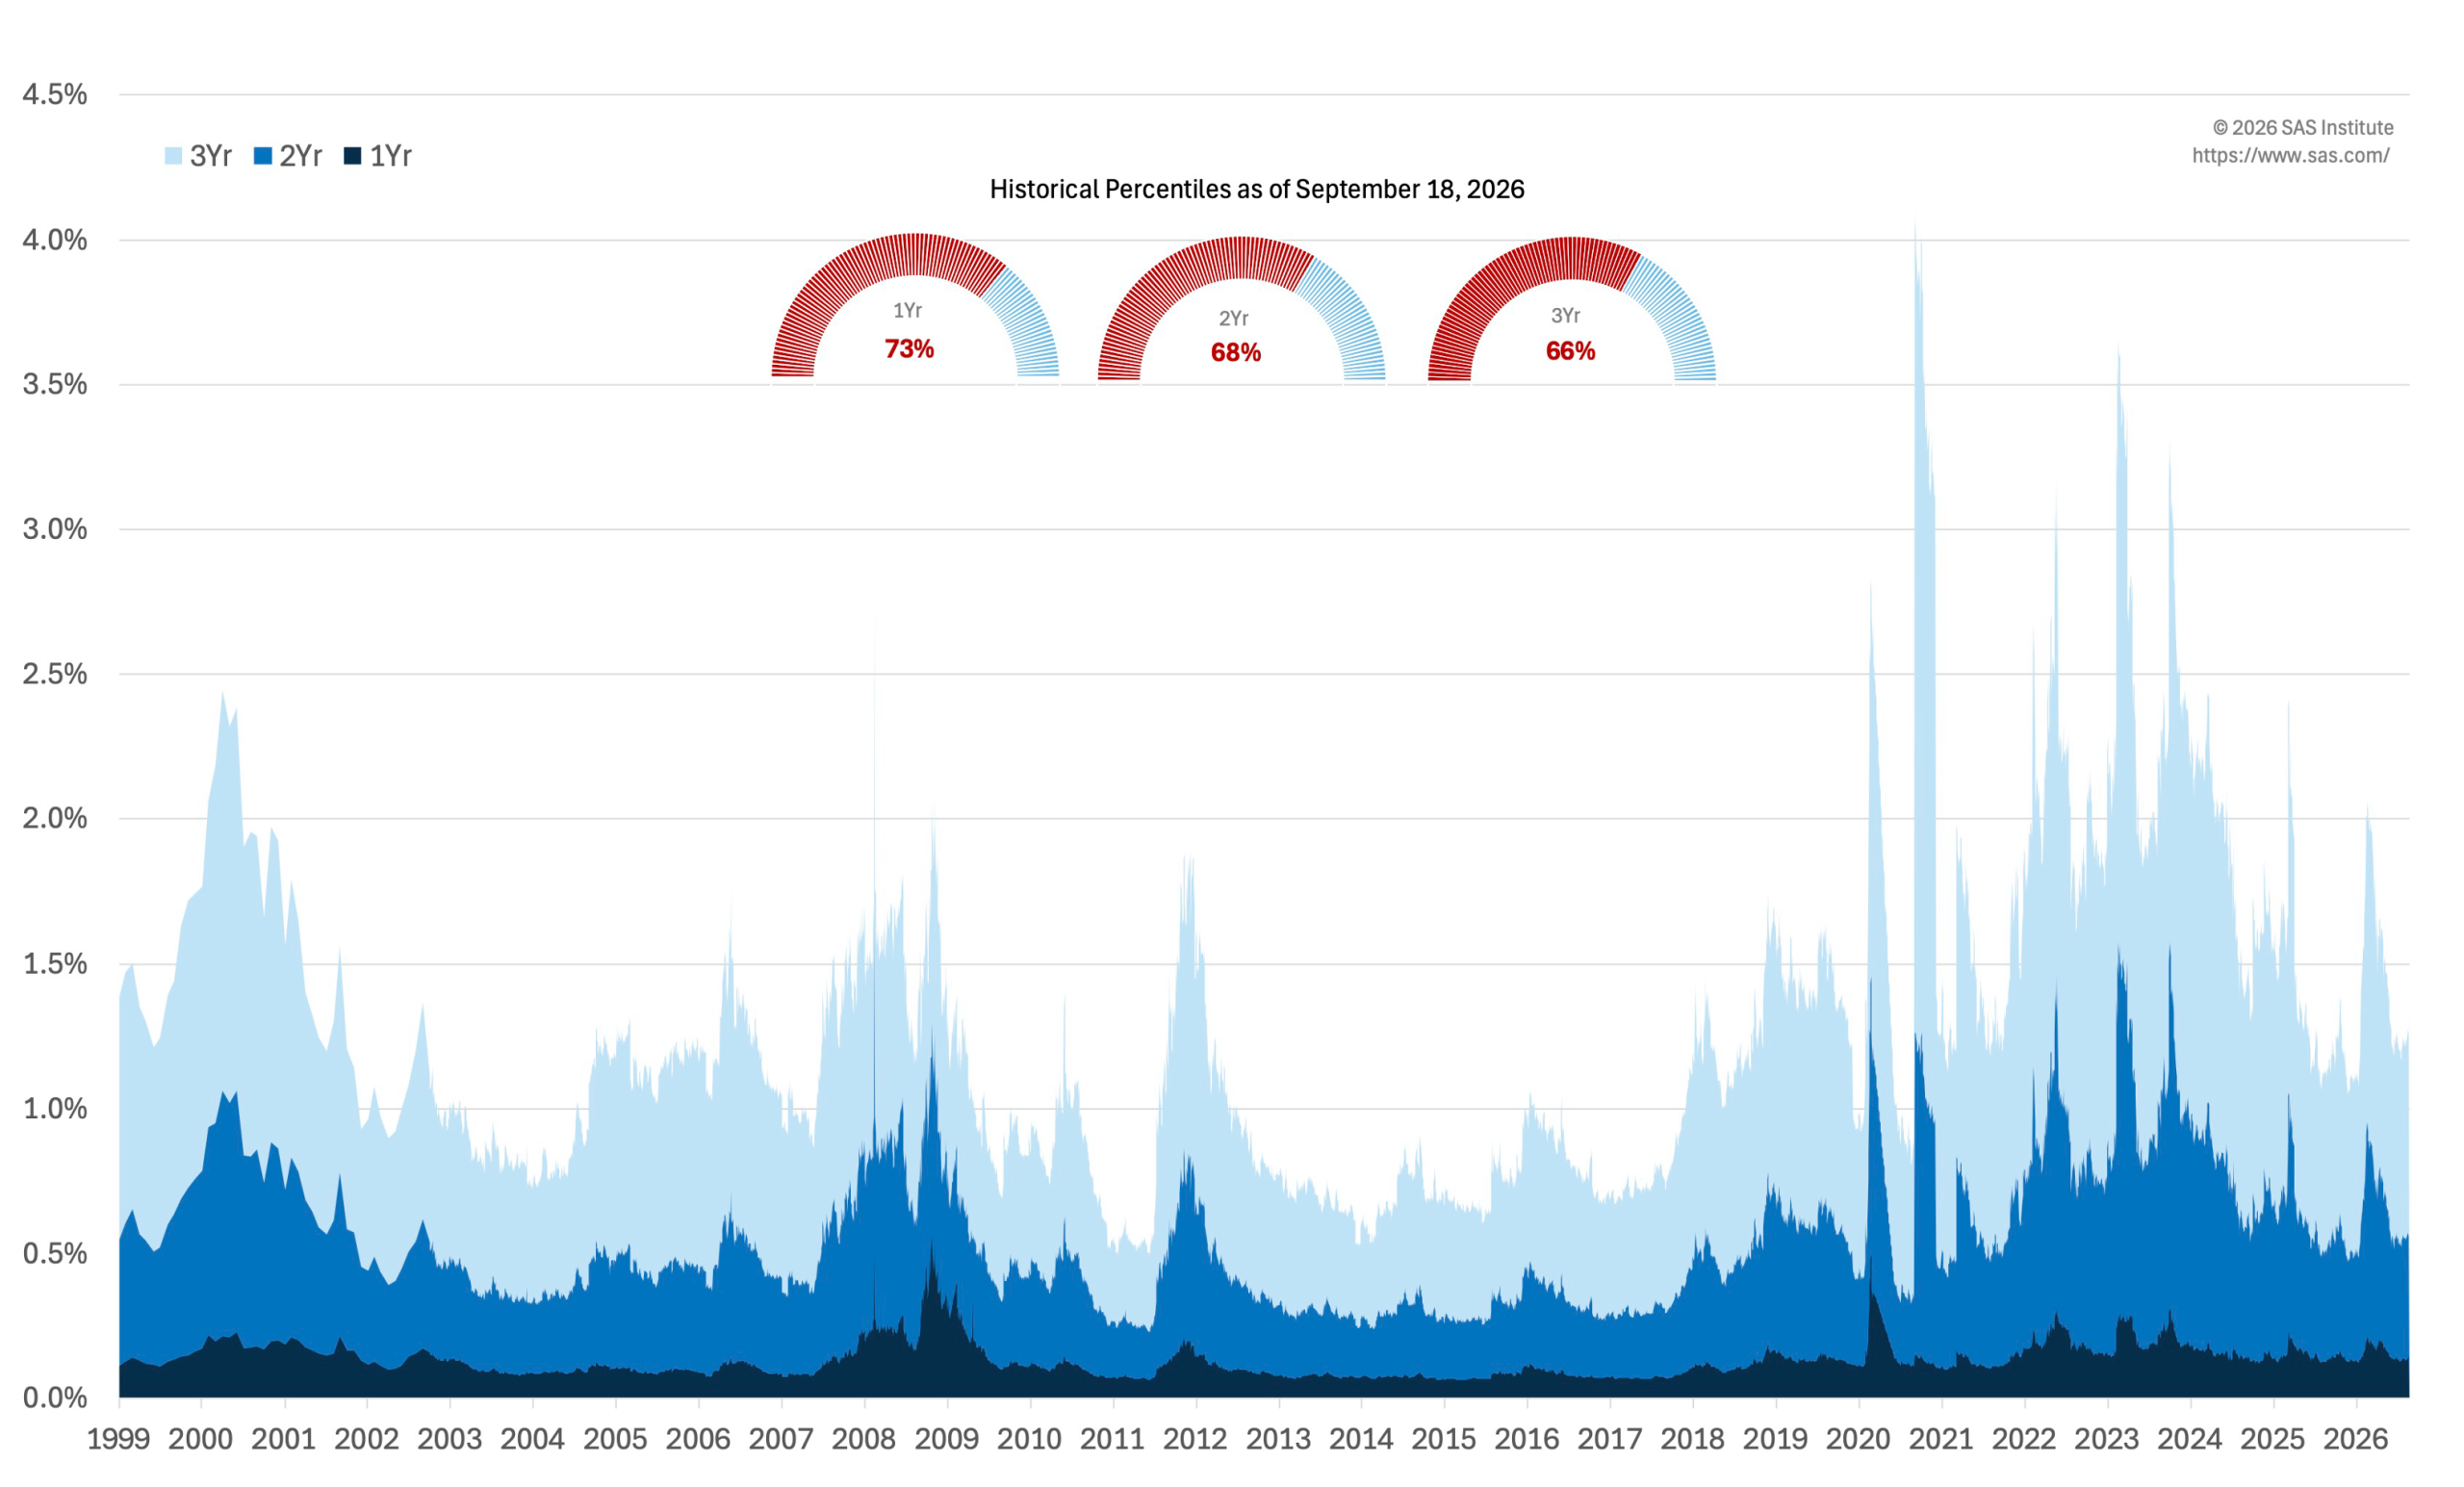
Table 3: Market Cap-Weighted Average 1-year Default Probability (Top 3000 Firms in the United States)
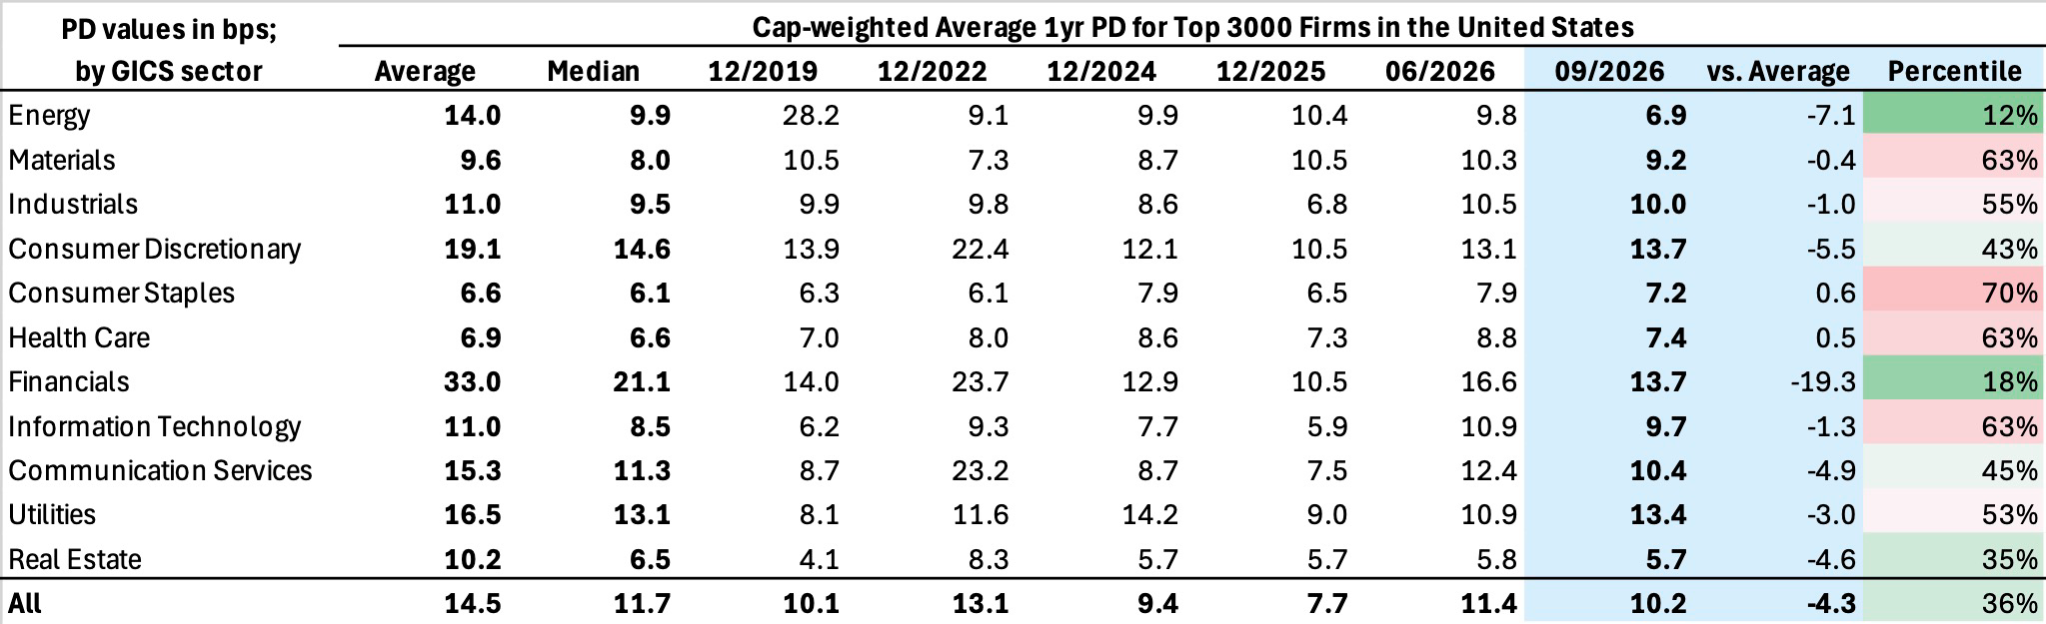
Table 4: Median 1-year Default Probability (Top 3000 Firms in the United States)
Why KRIS PD forecasts matter now. Market prices can remain calm even as underlying risk becomes more concentrated, making model‑based, issuer‑level signals increasingly important. KRIS default probabilities provide daily, issuer‑level signals that help make this bifurcation visible: pinpointing names where refinancing pressure, equity‑volatility shocks, or weakening coverage metrics are emerging even when credit spreads do not move. Used alongside market spreads and fundamental analysis, PDs help identify risks that are not yet fully priced, providing actionable early‑warning signals.
Appendix
Table 5: Riskiest Rated Companies Based on 1-year PD
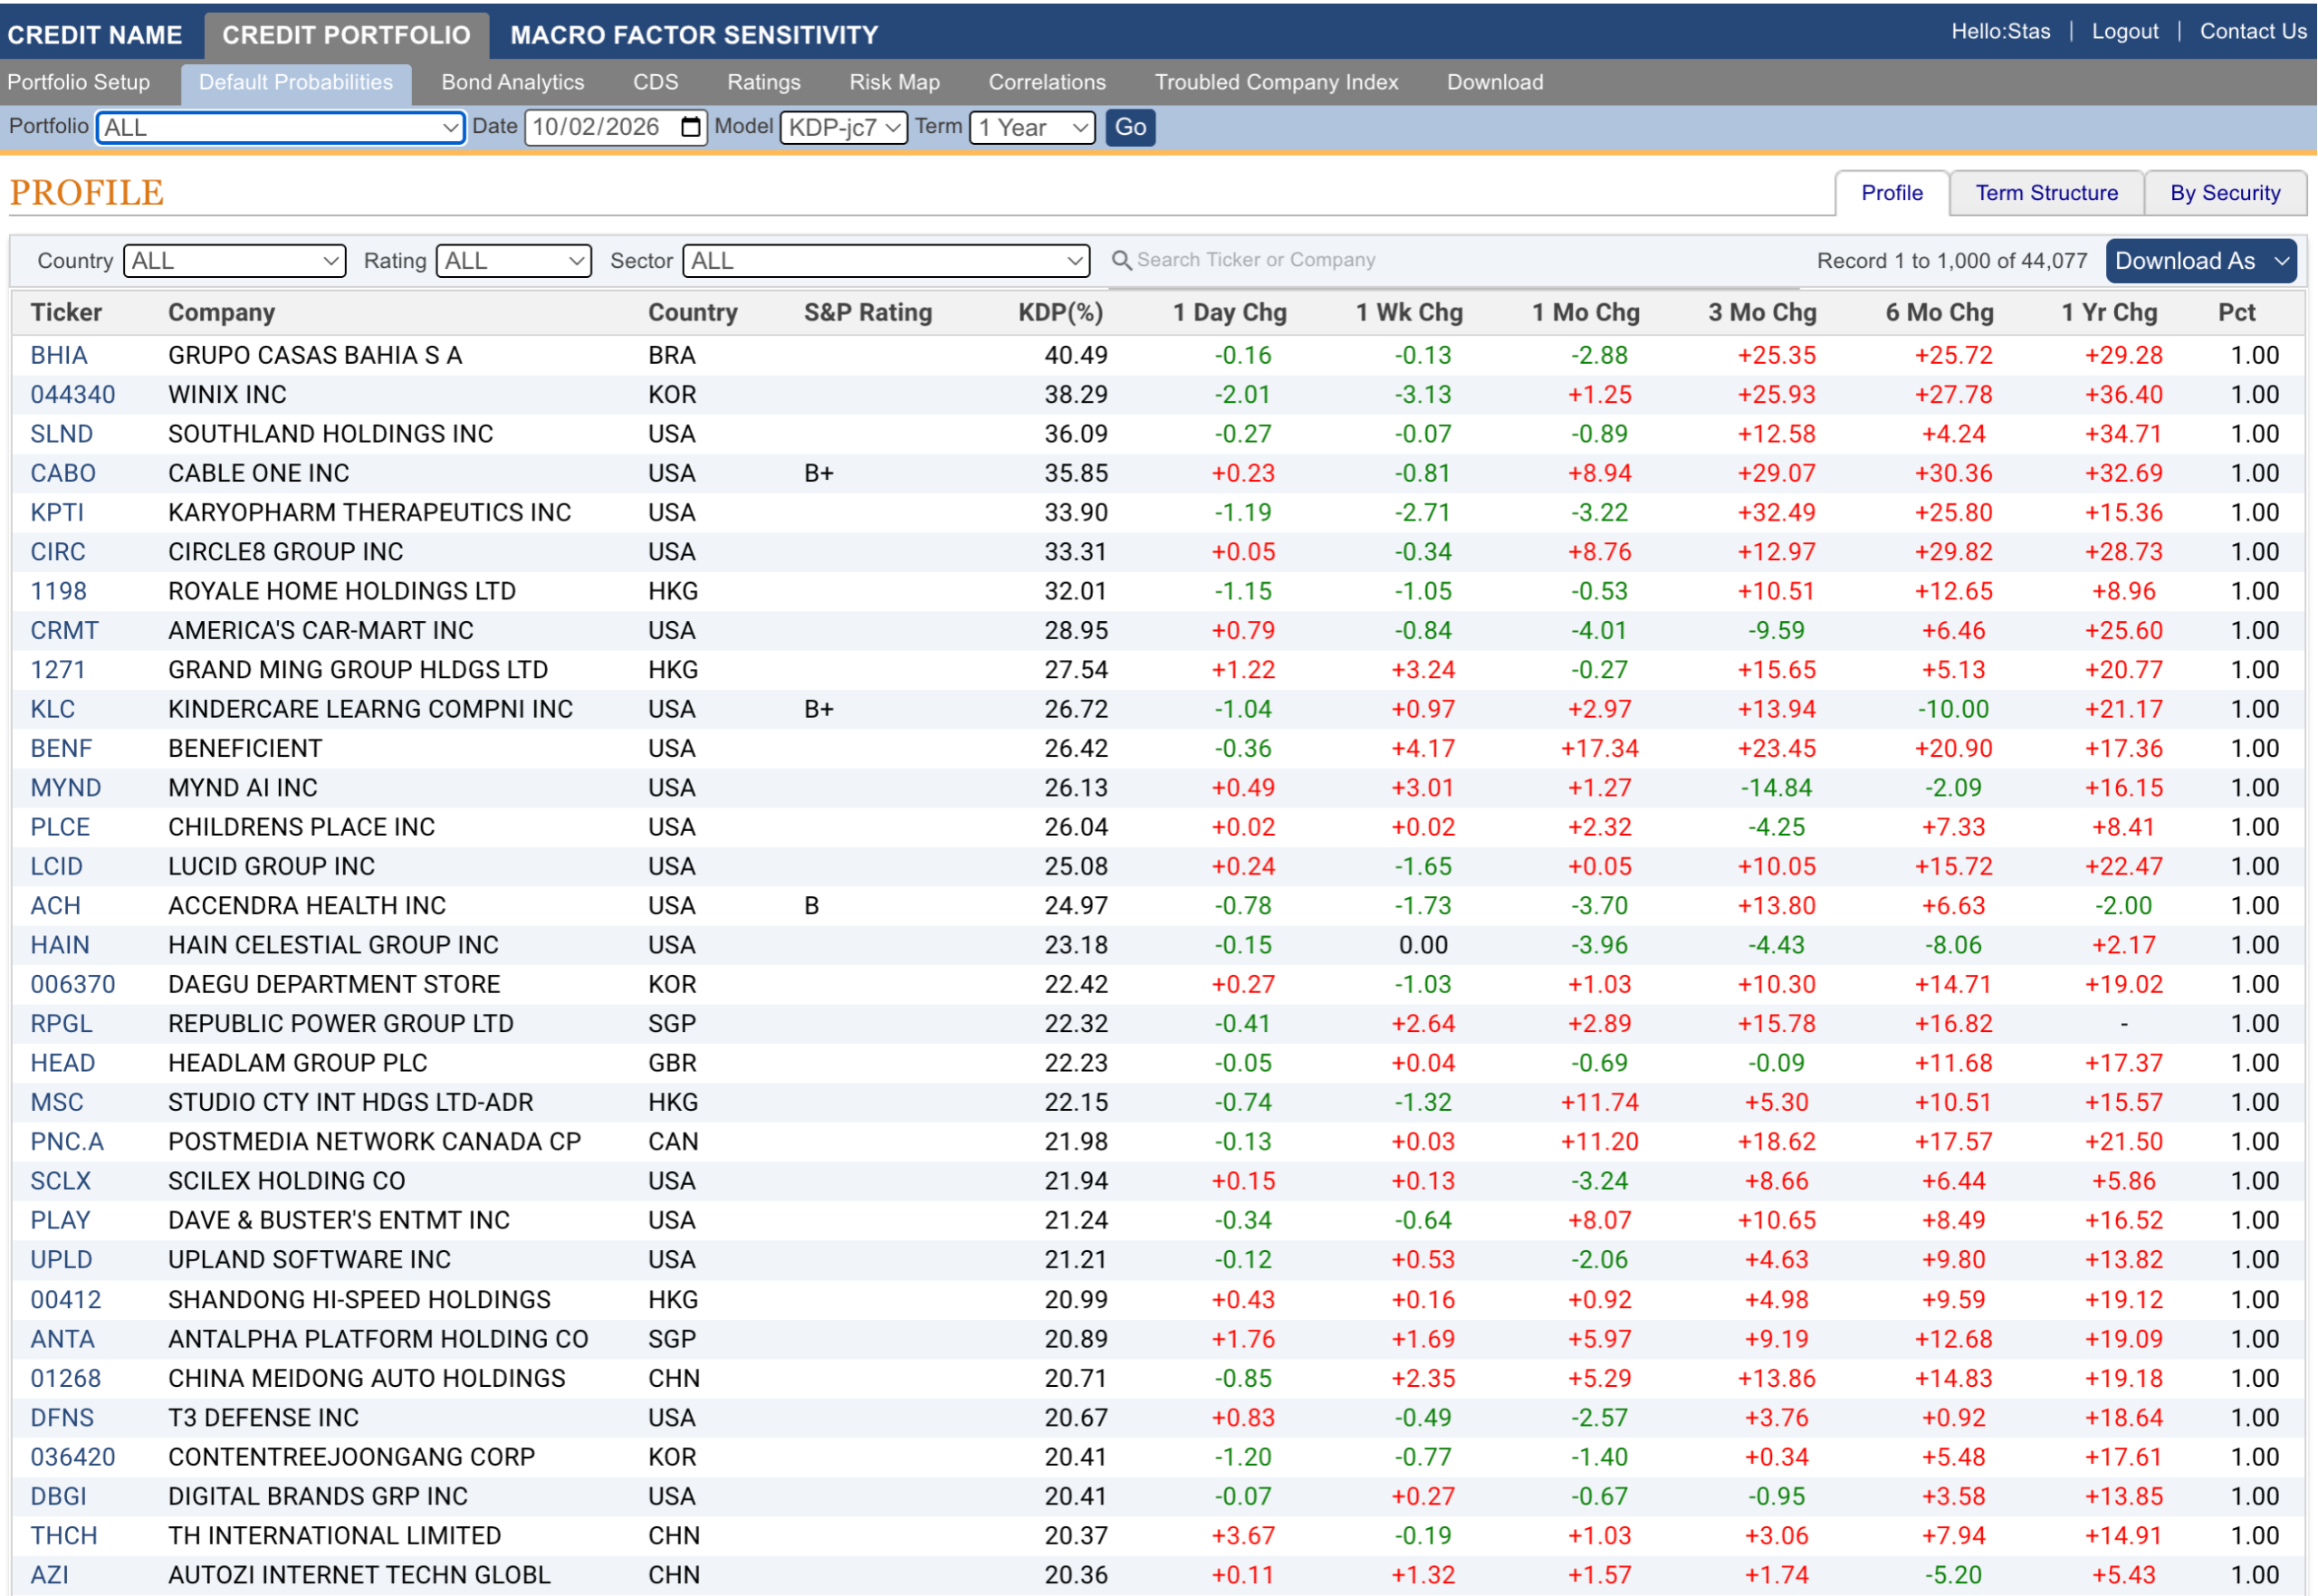
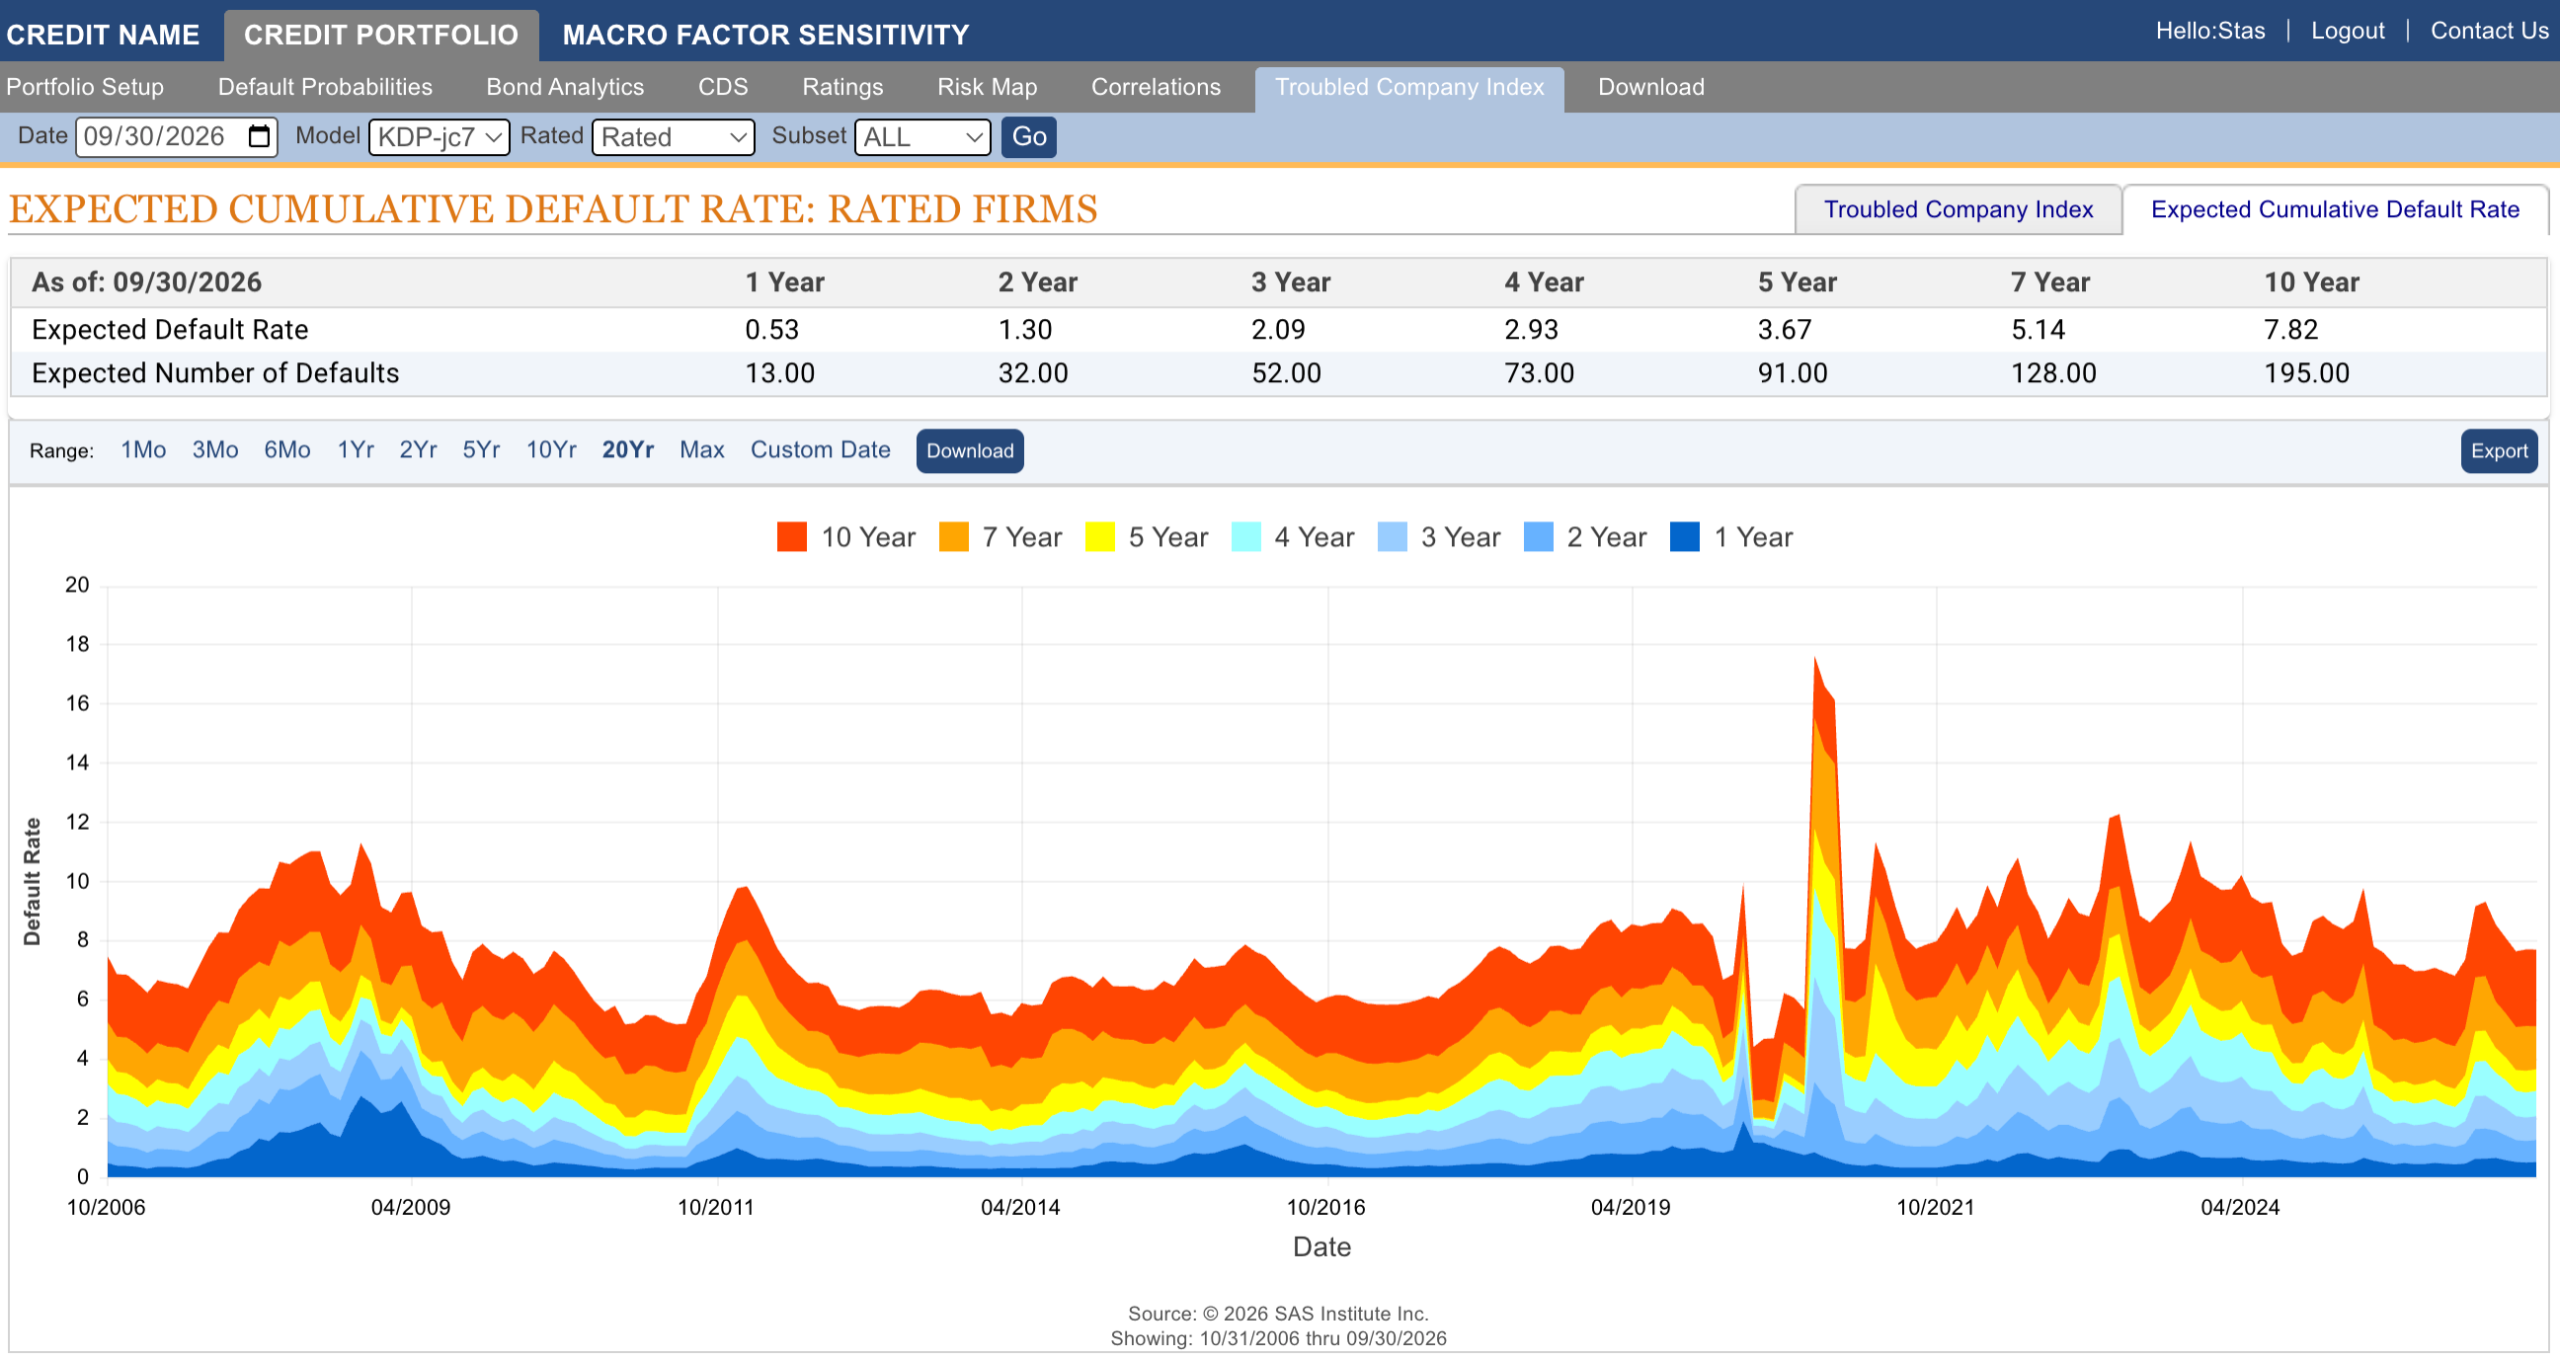
Figure 5: Expected Cumulative Default Rates
About SAS
SAS is the leader in analytics. Through innovative software and services, SAS empowers and inspires customers around the world to transform data into intelligence. SAS gives you THE POWER TO KNOW®.
Editorial contact: Stas Melnikov – stas.melnikov@sas.com