

NEW YORK July 1, 2025: The history of U.S.-China trade in some ways mirrors the history of China itself: periods of stability and growth punctuated by radical shifts that have realigned industries, financial markets, and the actions of central banks. We are in the midst of one of those major shifts today, and money managers need to rethink their investment and risk allocation strategies accordingly. This month’s commentary will place the current U.S.-China relationship in historical perspective and lay out some of the most important factors financial managers should take into account.
The Advent of Global Trade
Modern globalization began in the aftermath of World War II, with the formation of the Bretton Woods institutions and the GATT treaty, followed by the creation of the WTO. China’s economic opening, Western outsourcing, and the rise of the internet and ecommerce created the supply chains we are familiar with today. Open markets, cheap goods, and mutual gain all seemed to confirm the law of comparative advantage, and the integrationist approach to trade held sway. Western financial leaders believed that granting China membership in global institutions like the WTO would lead the country to adopt international standards of economic conduct, such as providing investment visibility and respecting intellectual property rights and the rule of law.
China, however, failed to follow that playbook. Its exports boomed for decades, but instead of conforming its economic standards with those of the West, it maintained strong state control of private businesses and developed entirely state-owned firms in key industries. For U.S. companies, the decision to access to Chinese markets was a strategic one, made on the basis of potential economic gains, despite the flaws in policy governance.
The pattern of integration and growth continued for decades, bringing a wealth of low-cost goods to U.S. consumers and a higher standard of living to millions of Chinese factory workers.
From Integration to Decoupling
After years of sub rosa grumbling, concerns about national security, cyber theft, and IP espionage began to dominate the public discourse, leading to the current state of U.S.-China decoupling, which began over a decade ago.
With its “Made in China 2025” policy, China has publicly announced the intention to end its status as “the world’s factory” of low-cost consumer products and shift its focus to developing the domestic market and becoming an advanced technology powerhouse. Export restrictions and the promotion of self-reliance in critical technologies were already underway before the first set of Trump tariffs in 2018. The Covid pandemic made existing supply chain risks and dependencies visible to the markets, providing additional rationale for decoupling, though efforts mostly remained beneath the surface. The 2025 tariffs accelerated the decoupling movement and are now driving a strategic realignment in trade, supply chains and global alignments.
Effect on Industries
While supply chain restructuring and technology trade restrictions have been playing out for several years, a more accelerated decoupling has become evident in the reduction in U.S.-China trade since the record year of 2022. The funds flow from China has been negative since 2020, and foreign direct investment in China by U.S. firms has dropped sharply. China, once a large investor in U.S. Treasuries, has shifted some of those investments out of the U.S. Even the flow of people has changed. Only 469 American students were studying in China in the 2022-2023 academic year—the lowest number in two decades. India has now overtaken China as the largest contributor of foreign students to the U.S.
What are the implications of these trends with respect to economic risks and opportunities? Manufacturing supply chains have been redirected from China to Vietnam, Malaysia, Mexico and India. Commodities, energy, and retail—especially discretionary purchases and automobiles—are also impacted by decoupling dynamics. Critical sectors like semiconductors, pharmaceuticals, and rare earths are particularly focused on supply chain diversification, and agriculture and mining are vulnerable to tariffs and political retaliation.
New supply chain alliances also pose the risk of depending on regional pricing hubs, rather than a global market. That would introduce additional price volatility and could pose challenges to effective hedging strategies.
Effect on Markets
Greater uncertainty around costs and questions about processing efficiency have led to an inflationary bias for finished goods. This bias is causing central banks to react with caution. Should they tolerate higher inflation, or implement more frequent tightening schedules and risk a slowdown? In the U.S., the interest curve could shift higher, as the Fed is slower to cut the short end and markets demand higher long-term rates to stimulate demand, especially given government deficits.
In the capital markets, there has been talk about decoupling’s impact on currency and reserve dynamics. Efforts by China and others to “de-dollarize” trade may pose a long-term risk to USD dominance, but in the short term it is muted by the lack of viable alternatives.
Preparing for Change
As noted, the structural realignments of global trade have been quietly underway for a decade, but the speed and risks of the process are accelerating. Fortunately, our default models are very good at capturing macroeconomic relationships, as well as shifts in volatility and interest rates.
In light of the systemic changes that are evolving, we are working on ways to use our models to identify their sector and firm impacts. Given increased uncertainty, the goal is to identify red flags so investors and lenders can prepare for potential risks and profit from potential opportunities. In the months ahead, we will focus on early warning systems finance professionals can use to navigate this evolving environment.
Contemporaneous Credit Conditions
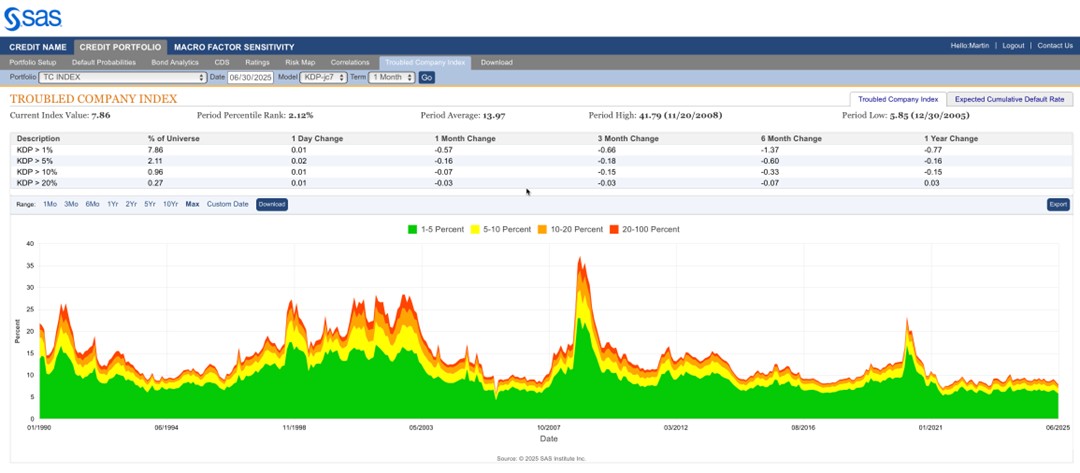
The Kamakura Troubled Company Index® closed the month at 7.86%, down 0.57% from the prior month. The index measures the percentage of 42,500 public firms worldwide with an annualized one-month default probability of over 1%. An increase in the index reflects declining credit quality, while a decrease reflects improving credit quality.
At the end of June, the percentage of companies with a default probability between 1% and 5% was 5.75%. The percentage with a default probability between 5% and 10% was 1.15%. Those with a default probability between 10% and 20% amounted to 0.69% of the total; and those with a default probability of over 20% amounted to 0.27%. For the month, short-term default probabilities ranged from a low of 7.79% on June 11 to a high of 8.33% on June. 2
Figure 1: Troubled Company Index®, June, 2025
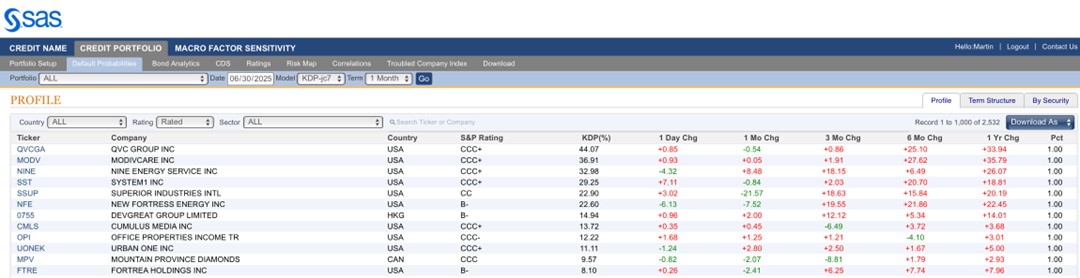
At the end of June, the riskiest 1% of rated public firms within the coverage universe as measured by 1-month default probability included ten companies in the U.S., and one each in Canada and China. QVC Group, Inc (NASDAQ:QVCGA) remained the riskiest rated firm in our universe, with a 1-month KDP of 44.07–down 0.54% over the past month.
Table 1: Riskiest Rated Companies Based on 1-month KDP, June 30, 2025
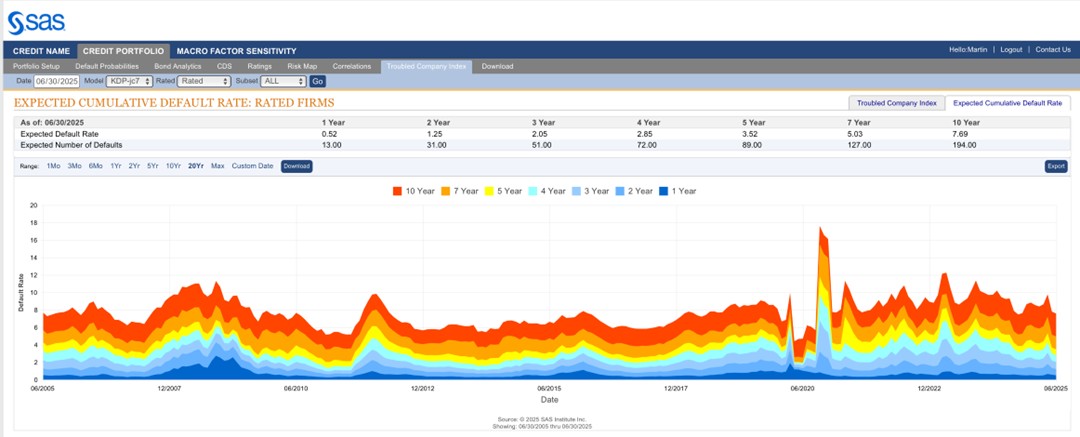
The Expected Cumulative Default Rate, the only daily index of credit quality of rated firms worldwide, shows the one-year rate of 0.52% down 0.05% from the prior month, with the 10-year rate down 0.08% at 7.69%.
Figure 2: Expected Cumulative Default Rates, June 30, 2025
About the Troubled Company Index
The Kamakura Troubled Company Index® measures the percentage of 42,500 public firms in 76 countries that have an annualized one-month default risk of over one percent. The average index value since January 1990 is 13.97%. Since July 2022, the index has used the annualized one-month default probability produced by the KRIS version 7.0 Jarrow-Chava reduced form default probability model, a formula that bases default predictions on a sophisticated combination of financial ratios, stock price history, and macro-economic factors.
The KRIS version 7.0 models were developed using a data base of more than 4 million observations and more than 4,000 corporate failures. A complete technical guide, including full model test results and key parameters, is provided to subscribers. Available models include the non-public-firm default model, the U.S. bank model, and the sovereign model.
The version 7.0 model was estimated over the period from 1990, through the Great Recession and ending in February 2022. The 76 countries currently covered by the index are Argentina, Australia, Austria, Bahrain, Bangladesh, Belgium, Belize, Botswana, Brazil, Bulgaria, Canada, Chile, China, Colombia, Croatia, Cyprus, Czech Republic, Denmark, Egypt, Estonia, Finland, France, Germany, Ghana, Greece, Hungary, Hong Kong, Iceland, India, Indonesia, Ireland, Israel, Italy, Japan, Jordan, Kenya, Kuwait, Luxembourg, Malaysia, Malta, Mauritius, Mexico, Nigeria, the Netherlands, New Zealand, Norway, Oman, Pakistan, Peru, the Philippines, Poland, Portugal, Qatar, Romania, Russia, Saudi Arabia, Serbia, Singapore, Slovakia, Slovenia, South Africa, South Korea, Spain, Sri Lanka, Sweden, Switzerland, Tanzania, Taiwan, Thailand, Turkey, the United Arab Emirates, Uganda, the UK, the U.S., Vietnam and Zimbabwe.
About SAS
SAS is the leader in analytics. Through innovative software and services, SAS empowers and inspires customers around the world to transform data into intelligence. SAS gives you THE POWER TO KNOW®.
Editorial Contacts:
- Martin Zorn – Martin.Zorn@sas.com
- Stas Melnikov – Stas.Melnikov@sas.com