
In a recent post on SeekingAlpha, we pointed out that a forecast of “heads” or “tails” in a coin flip leaves out critical...


In a recent post on SeekingAlpha, we pointed out that a forecast of “heads” or “tails” in a coin flip leaves out critical...

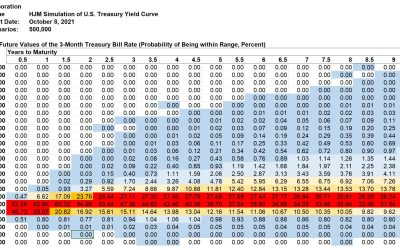
Donald R. van Deventer[1] First Version: October 6, 2021 This Version: October 6, 2021 ABSTRACT Please note: Kamakura...

In a recent post on SeekingAlpha, we pointed out that a forecast of “heads” or “tails” in a coin flip leaves out critical...

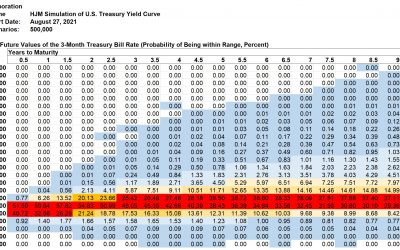
Donald R. van Deventer[1] First Version: September 28, 2021 This Version: September 30, 2021 ABSTRACT Please note: Kamakura...

In a recent post on SeekingAlpha, we pointed out that a forecast of “heads” or “tails” in a coin flip leaves out critical...

In a recent post on SeekingAlpha, we pointed out that a forecast of “heads” or “tails” in a coin flip leaves out critical...
In a recent post on SeekingAlpha, we pointed out that a forecast of “heads” or “tails” in a coin flip leaves out critical...
In a recent post on SeekingAlpha, we pointed out that a forecast of “heads” or “tails” in a coin flip leaves out critical...
In a recent post on SeekingAlpha, we pointed out that a forecast of “heads” or “tails” in a coin flip leaves out critical...

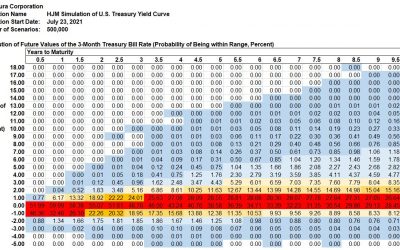
Donald R. van Deventer[1] First Version: July 19, 2021 This Version: July 19, 2021 ABSTRACT Please note: Kamakura Corporation...

In a recent post on SeekingAlpha, we pointed out that a forecast of “heads” or “tails” in a coin flip leaves out critical...
With inflation obviously on the rise, any rational investor should be asking “How well do U.S. Treasury yields forecast...