
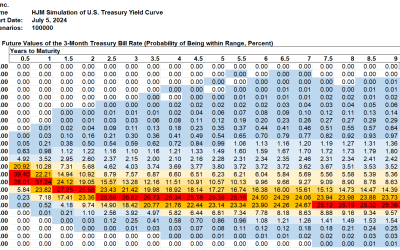
Summary The Treasury curve was down 11 basis points at 2 years and was down 8 basis points at 10 years over the last week. As a...


Summary The Treasury curve was down 11 basis points at 2 years and was down 8 basis points at 10 years over the last week. As a...
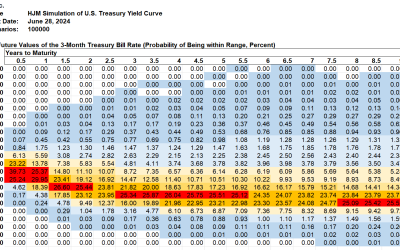
Summary The Treasury curve was up 1 basis point at 2 years and was up 11 basis points at 10 years over the last week. As a...
Summary The inverted Bund yields continued this week with the negative 2-year/10-year yield spread at negative 32.3 basis points...
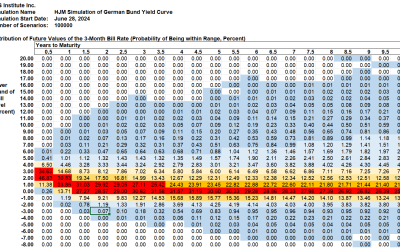
Summary The inverted Bund yields continued this week with the negative 2-year/10-year yield spread at negative 37.4 basis points...
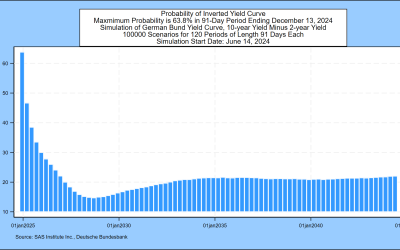
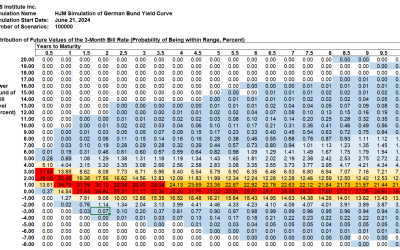
Summary The inverted Bund yields continued this week with the negative 2-year/10-year yield spread at negative 39.2 basis points...
Summary The inverted Bund yields continued this week with the negative 2-year/10-year yield spread at negative 45.9 basis points...
Summary The Treasury curve was up 9 basis points at 2 years and was up 12 basis points at 10 years over the last week. As a...
Summary The inverted Bund yields continued this week with the negative 2-year/10-year yield spread at negative 49.2 basis points...
Summary The inverted Bund yields continued this week with the negative 2-year/10-year yield spread at negative 42.2 basis...
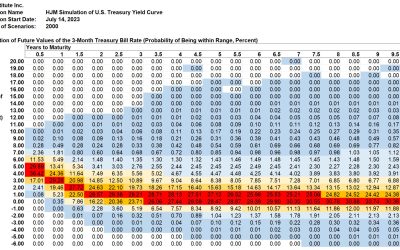
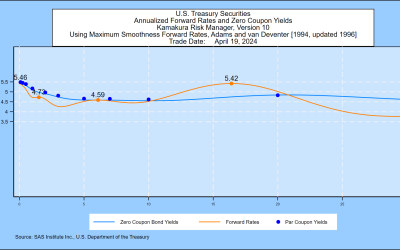
This week’s U.S. Treasury yield curve shifts reversed most of the increase from the prior week. The long-term peak in 1-month...
Daniel Dickler, Robert Jarrow, Stas Melnikov, Alexandre Telnov, Donald R. van Deventer and Xiaoming Wang[1] First Version: April...

Daniel Dickler, Robert A. Jarrow, Stas Melnikov, Alexandre Telnov, Donald R. van Deventer and Xiaoming Wang[1] First Version:...