
Donald R. van Deventer First Version: January 24, 2022 This Version: January 25, 2022 ABSTRACT Please note: Kamakura...


Donald R. van Deventer First Version: January 24, 2022 This Version: January 25, 2022 ABSTRACT Please note: Kamakura...

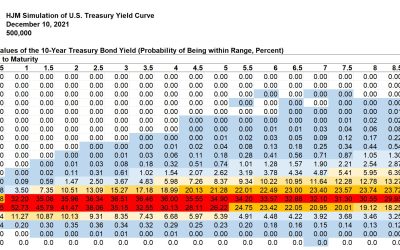
Donald R. van Deventer January 18, 2022 With inflation obviously on the rise, any rational investor should be asking “How well...

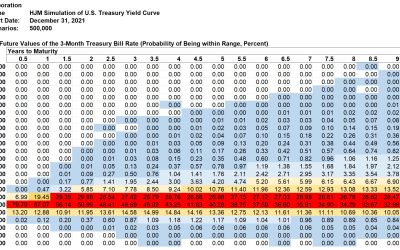
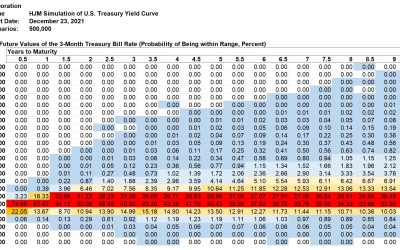
This week’s simulation shows that the most likely range for the 3-month U.S. Treasury bill yield in ten years is from 0% to 1%. ...
This week’s simulation shows that the most likely range for the 3-month U.S. Treasury bill yield in ten years is from 0% to 1%. ...
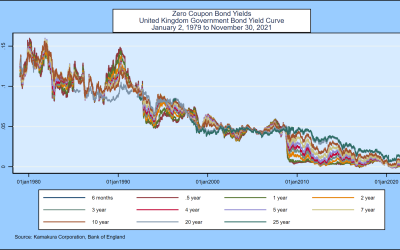
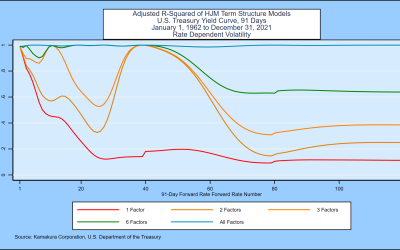
A 15-Factor Heath, Jarrow, and Morton Stochastic Volatility Model for the United Kingdom Government Bond Yield Curve, Using...
This week’s simulation shows that the most likely range for the 3-month U.S. Treasury bill yield in ten years is from 0% to 1%. ...
This week’s simulation shows that the most likely range for the 3-month U.S. Treasury bill yield in ten years is from 0% to 1%. ...
This week’s simulation shows that the most likely range for the 3-month U.S. Treasury bill yield in ten years is from 0% to 1%. ...
This week’s simulation shows that the most likely range for the 3-month U.S. Treasury bill yield in ten years is from 0% to 1%. ...
Donald R. van Deventer[1] First Version: December 6, 2021 This Version: December 7, 2021 ABSTRACT Please note: Kamakura...