Default Probabilities versus Credit Ratings
Spread and Ratings Analysis
This graph shows the distribution of ratings by default probability level and vice-versa. It illustrates low correlation between credit ratings and KRIS default probabilities:

Credit ratings usually explain less than 45% of the variation in KRIS default probabilities as shown below.

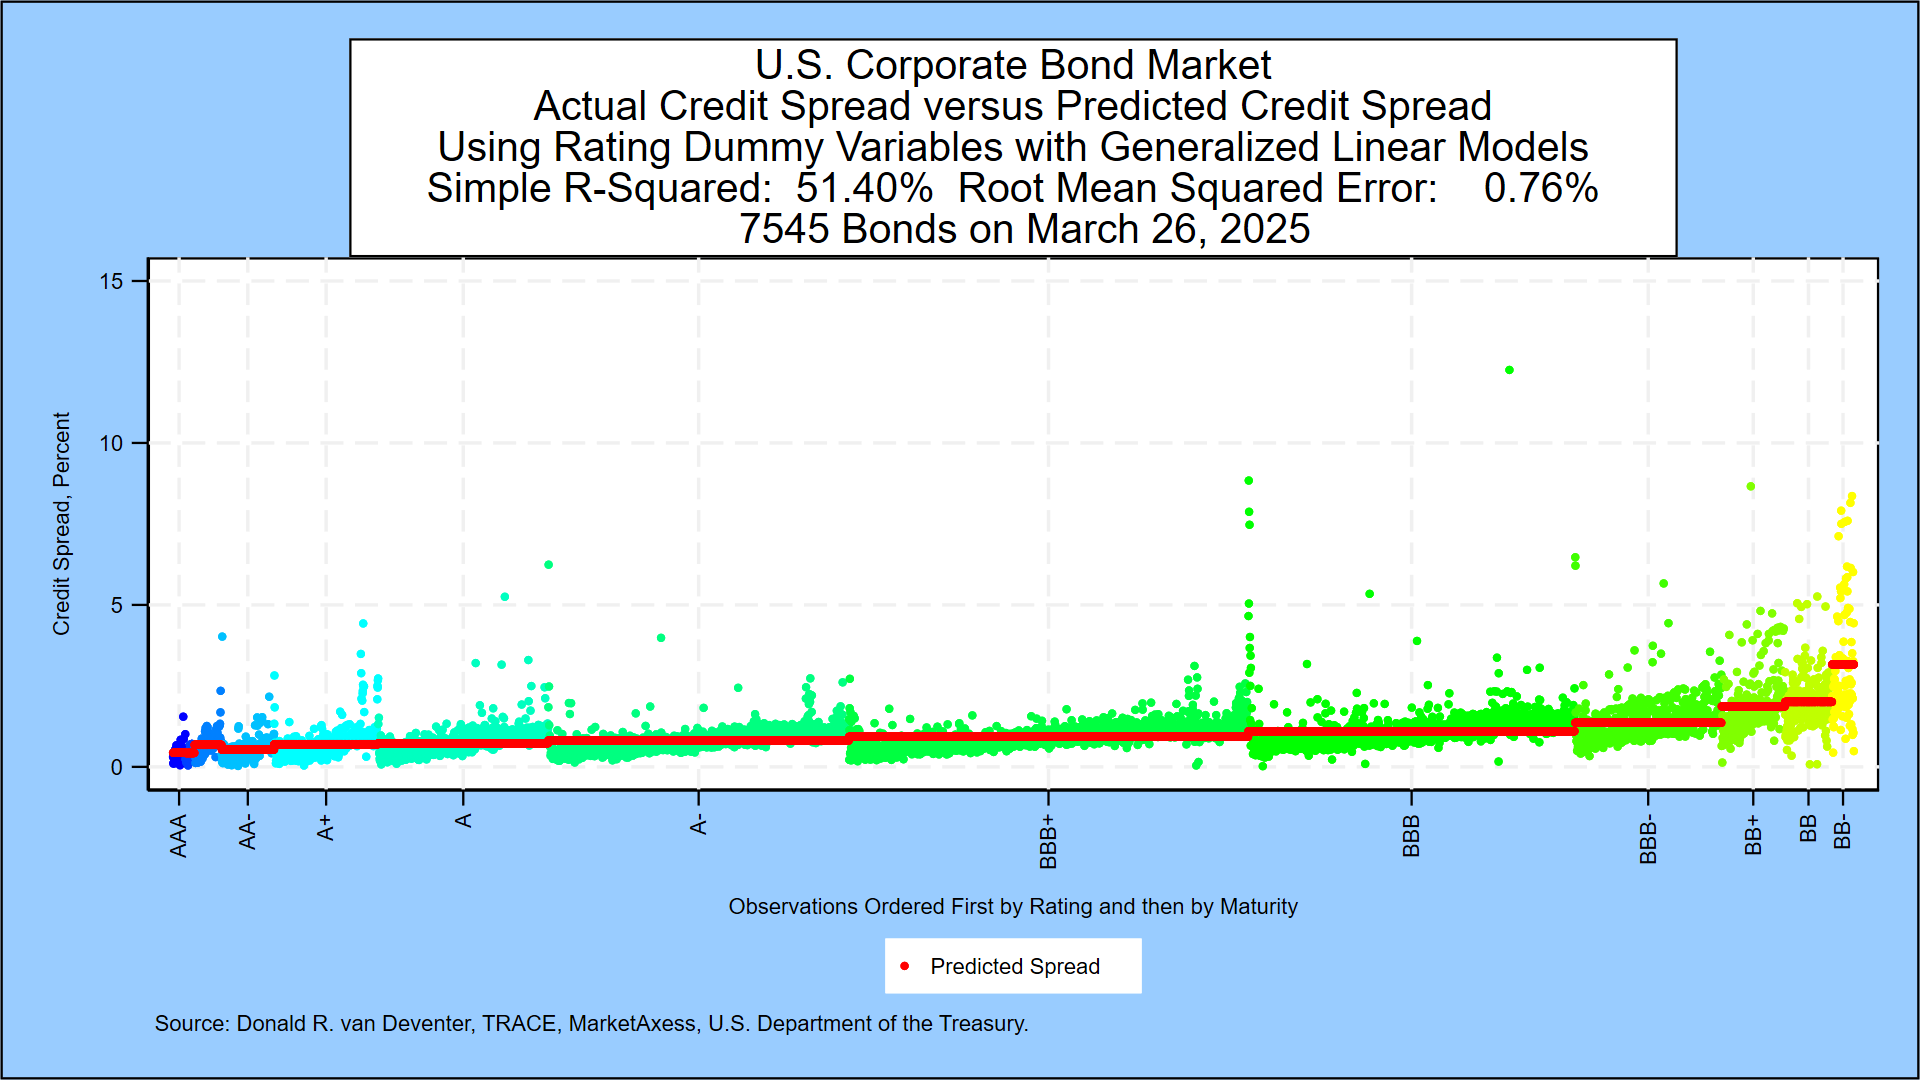
The current mapping of credit spreads and credit ratings, based on all corporate fixed rate bonds which traded at least $1 million for the day, are shown here:
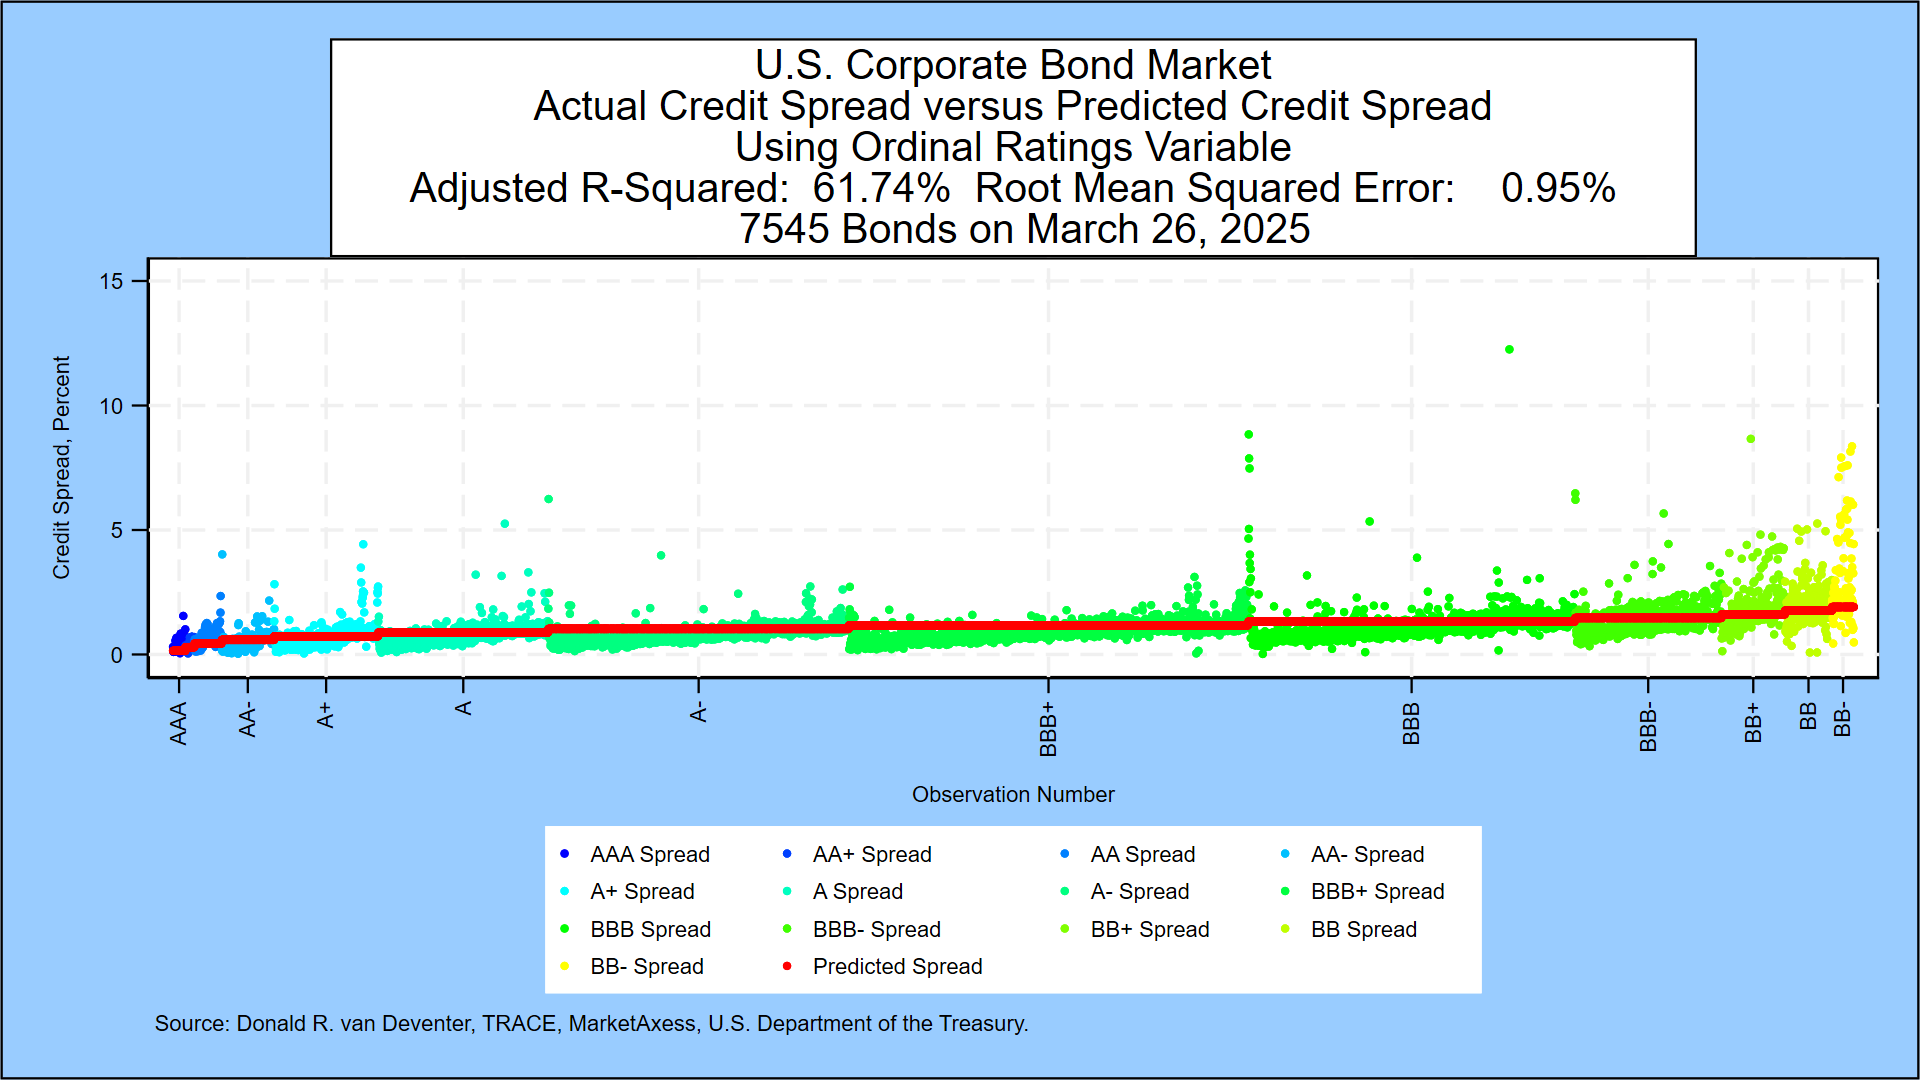
As is the case with default probabilities, the correlation of credit ratings with traded senior debt credit spreads in the U.S. market on the day was low. Credit ratings explain less than 70% of the variation in traded bond spreads on any given day if you use dummy variables for each variable, allowing higher rated companies to have higher spreads. If you use an ordinal variable (AAA = 1, AA+ = 2, etc.) to enforce a widening of spreads as ratings get weaker, explanatory power is much lower.
Here’s the same analysis using the ordinal variable to predict spreads from ratings:
The probability of each legacy rating, conditional on the credit spread being in the range for that row, is given in the table below. The median rating at each spread level is marked in red. These red squares can be interpreted as the “bond-implied rating” conditional on the given spread level. Ratings ignore maturity and that makes a direct spread to rating match very rough:

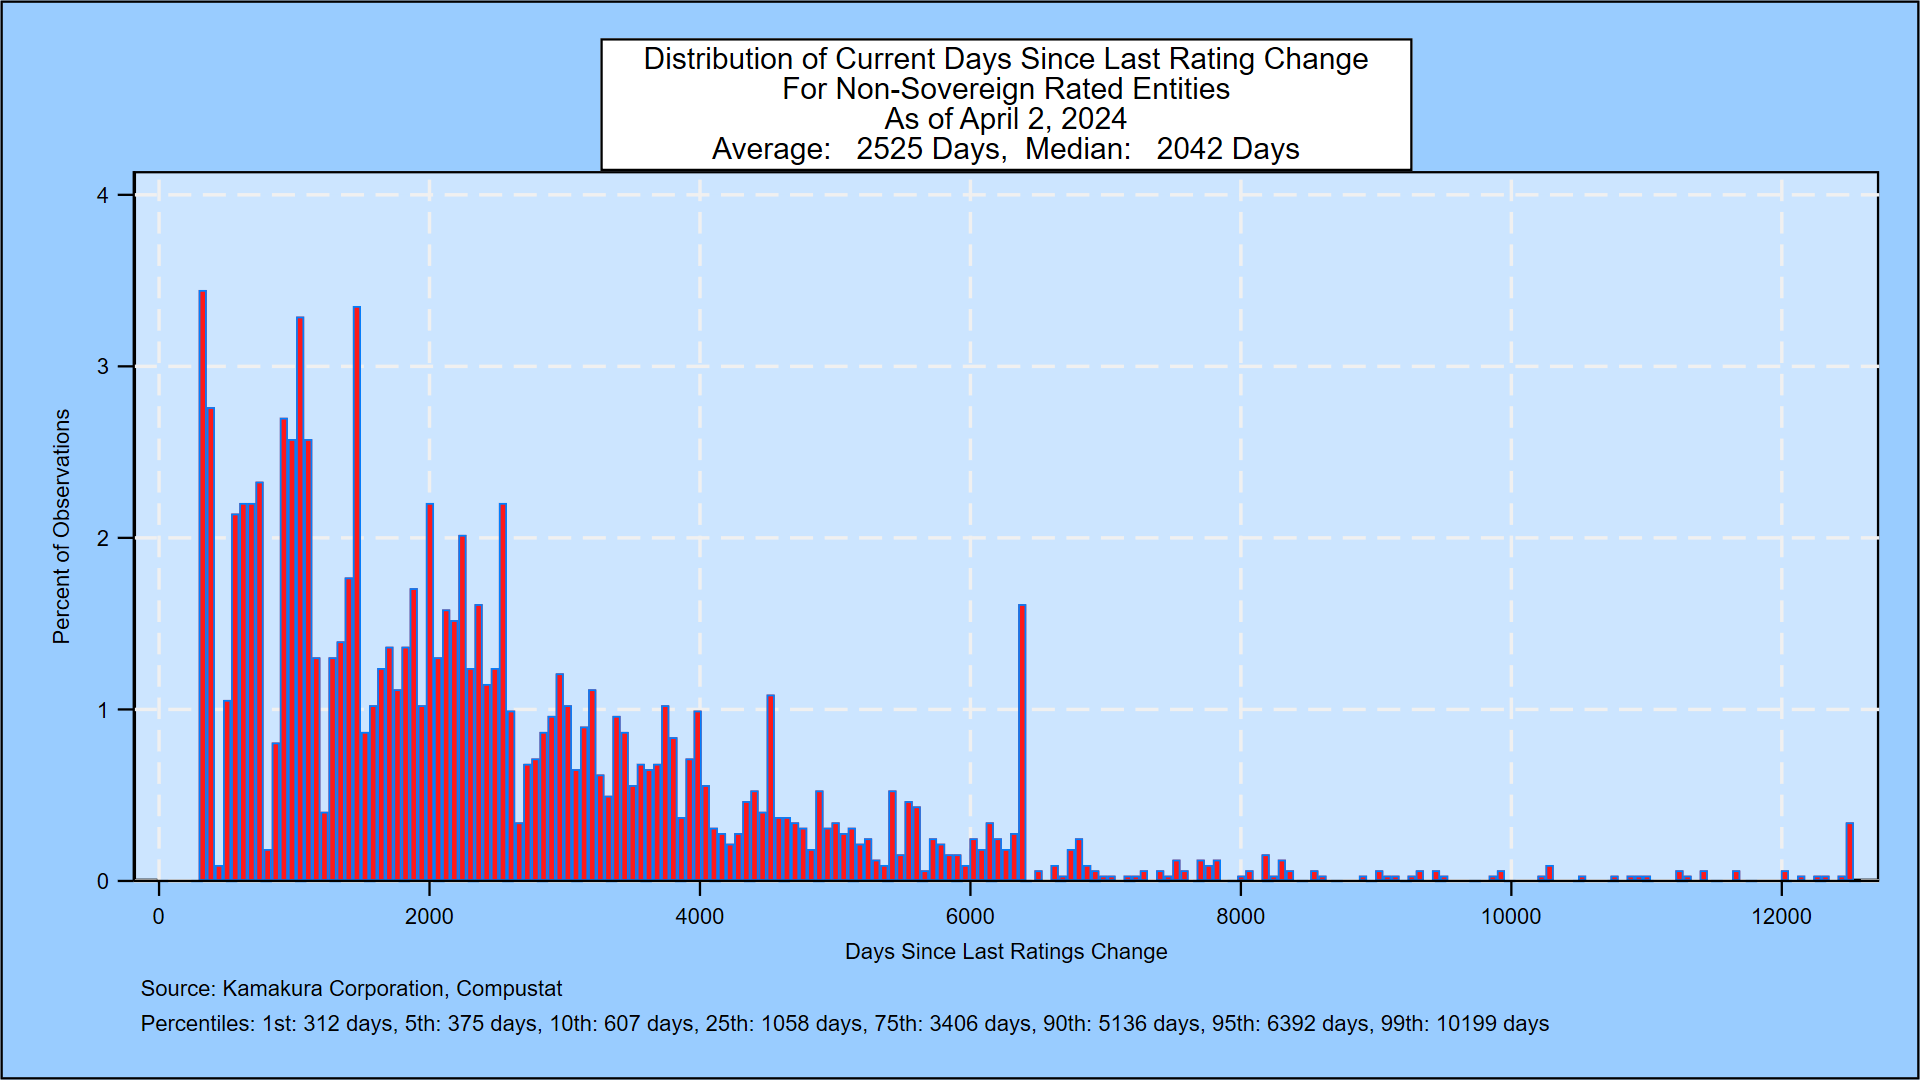
The median number of days since a change in credit ratings is now more than 1,400 days for 2655 public firms. By contrast, KRIS updates default probabilities for 42,500 public firms, 4900 U.S. banks & 183 sovereigns every day.