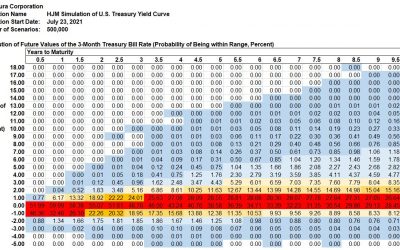
In a recent post on SeekingAlpha, we pointed out that a forecast of “heads” or “tails” in a coin flip leaves out critical...
CONNECT ME
A 10 Factor Heath, Jarrow, and Morton Stochastic Volatility Model for the U.S. Treasury Yield Curve, Using Daily Data from January 1, 1962 through June 30, 2021
Donald R. van Deventer[1] First Version: July 19, 2021 This Version: July 19, 2021 ABSTRACT Please note: Kamakura Corporation...
Kamakura Weekly Forecast, July 16, 2021: 3-month Treasury Bill Yield Distribution for 10 Years
In a recent post on SeekingAlpha, we pointed out that a forecast of “heads” or “tails” in a coin flip leaves out critical...
Kamakura Releases Future Ratings Model
New York, July 15, 2021: Kamakura Corporation has introduced a new Future Ratings model for its Kamakura Risk Information...
How Well Do U.S. Treasury Yields Forecast Inflation?
With inflation obviously on the rise, any rational investor should be asking “How well do U.S. Treasury yields forecast...
What a Difference a Year Makes. Kamakura Troubled Company Index Decreases by 3.54% to 2.78%.
What a Difference a Year Makes Kamakura Troubled Company Index Decreases by 3.54% to 2.78% Credit Quality Improves to the 100th...
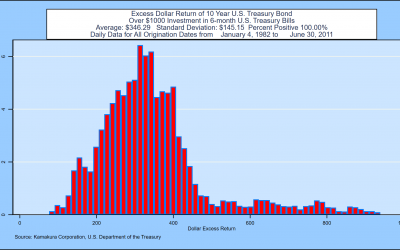
New on SeekingAlpha: U.S. Treasury Yields, The 10-Year Probabilities
In a new post on www.seekingalpha.com, I take on the issue of yield curve forecasting for a sophisticated general audience. ...


