

NEW YORK, June 2, 2023: In his 1989 book “One Up On Wall Street,” Peter Lynch has some prescient advice for today’s investors:
Getting the story on a company is a lot easier if you understand the basic business. That’s why I’d rather invest in panty hose than in communications satellites, or in motel chains than in fiber optics. The simpler it is, the better I like it. When somebody says, “Any idiot could run this joint,” that’s a plus as far as I’m concerned, because sooner or later any idiot probably is going to be running it.
The business world today is much more complex than it was in 1989, but understanding the fundamentals of a business has never been more important, as we explain in our Commentary below.
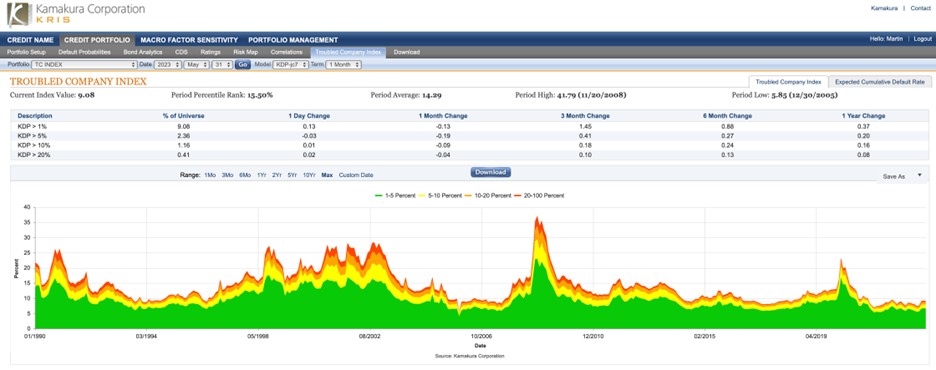
Contemporaneous credit conditions moderated in May, with the Kamakura Troubled Company Index® closing the month at 9.08%, down 0.13% from the prior month. The index measures the percentage of 41,500 public firms worldwide with an annualized one-month default probability of over 1%. An increase in the index reflects declining credit quality, while a decrease reflects improving credit quality.
At the end of May, the percentage of companies with a default probability between 1% and 5% was 6.72%. The percentage with a default probability between 5% and 10% was 1.20%. Those with a default probability between 10% and 20% amounted to 0.75% of the total; those with a default probability of over 20% amounted to 0.41%. Short-term default probabilities ranged from a low of 8.88% on May 22 to a high of 9.60% on May 16.
Figure 1: Troubled Company Index — May 31, 2023
At the end of May, the riskiest 1% of rated public firms within the coverage universe included eleven companies in the U.S. and one in the Luxemburg. The riskiest rated firm remained Cyxtera Technologies, Inc. (NASDAQ:CYXT), with a one-month KDP of 65.04%, up 12.51% from the previous month. There were twelve defaults in the KRIS coverage universe in April, with seven in the U.S., three in the UK and one each in Canada and Japan.
Table 1: Riskiest Rated Companies Based on 1-month KDP – May 31, 2023

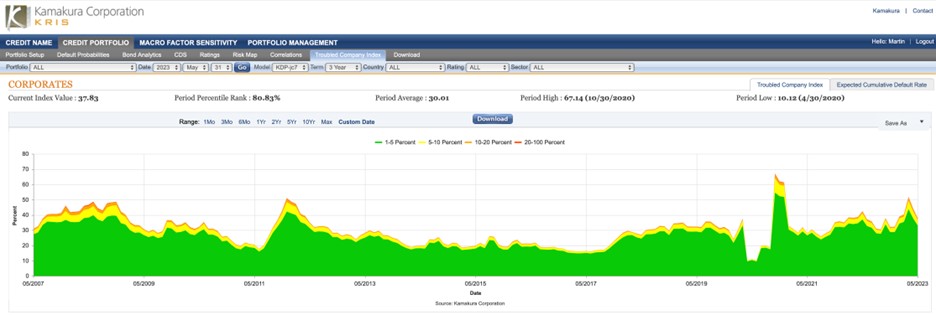
The three-year default probability provides a more forward-looking view than the one-month probability. As we look further out on the curve, the impact of higher interest rates, the reduction in market liquidity and the rollover risk of existing debt have a greater impact on credit quality. We also note that the three-year expected default rate has come down from its recent peak as the Fed signals a pause in interest rate hikes. Employment has remained strong, implying a possible soft landing for the economy.
Figure 2: 3-Year Term Default Probabilities – U.S. Market, May 31, 2023
The Kamakura Expected Cumulative Default Rate, the only daily index of credit quality of rated firms worldwide, shows the one-year rate down 0.10% at 0.86% with the 10-year rate down 0.81% at 9.90%.
Figure 3: Expected Cumulative Default Rate — May 31, 2023

Commentary
Stas Melnikov and Martin Zorn
SAS Institute Inc.
A former colleague of mine at the original Wachovia Bank used to say that anyone can make the simple complex, but the real challenge is to explain the complex and make it simple. Great investment managers, including Peter Lynch and Warren Buffet, have made it clear that companies can be richly rewarded for explaining their businesses in simple and understandable terms.
But business is not simple today. Global trade, complicated supply chains, foreign exchange risk, a decade of active central bank monetary policy, artificial intelligence, social media and instantaneous communications make our world complex. This is exactly why the ability to use tools that allow management to explain their businesses and financial drivers to the markets is so important.
Banking is an excellent example. With the recent failures of Silicon Valley Bank, Signature Bank and First Republic Bank still fresh in our minds, we can see that banks and their holding companies, with their opaque balance sheets, can be extremely complex, despite the fact that their business model – taking deposits, making loans and investments–is simple. In fact, it is often much easier to analyze and understand a manufacturing company than a community bank.
Examining large U.S. banking institutions, we can make several observations. Figure 4 shows us that the sector suffers from long periods of being boring and benign, interrupted by outbreaks of risk and even panic. In the current cycle, the sector seems to be bifurcated, with very low default risk among banks clearly deemed systemic and too big to fail, and higher risk among smaller, regional banks. In this latter group, trading in both the equity markets and spreads in the bond market seem to be driven in part by fundamental risk – loan concentrations, especially in commercial real estate, and concerns about subprime auto lending and the potential for unrealized losses in investment portfolios.
There is an observable benefit accruing to banks that have been transparent about risks, especially those surrounding the relationship between interest rates and mark-to-market investment value. Investors appreciate banks that provide clarity around the risk that their depositors may exercise their option to withdraw funds. The options world has many tools for evaluating the likelihood of option exercise, and banks that can describe their deposit franchise clearly enough to allow investors to utilize those tools will benefit. This is the art of translating the complex into the simple in a manner that benefits your customers.
Figure 4: Risk Among 25 Large US Banks based on 1-year KDP – as of May 31, 2023

General market uncertainty remains high, given the persistence of global inflation and the behavior of the employment markets. Ongoing debates about what constitutes real or fake news and whether artificial intelligence is good or threatening for humanity further contribute to fear and uncertainty.
Figure 5: Global Inflation IMF

In this environment, it is challenging for business leaders to optimize their use of capital and explain their strategy to investors and customers, yet it is more critical than ever for them to do so. With disruption occurring all around, investors are seeking safe havens—firms that are transparent, understandable and trustworthy. By using data-based analytical models, companies can clearly and objectively explain the drivers and risks that underpin every aspect of the business, from security and compliance to supply chain, product development and innovation.
SAS has the tools to help you turn analytics into answers.
About the Troubled Company Index
The Kamakura Troubled Company Index® measures the percentage of 41,500 public firms in 76 countries that have an annualized one-month default risk of over one percent. The average index value since January 1990 is 14.29%. Since July 2022, the Kamakura index has used the annualized one-month default probability produced by the KRIS version 7.0 Jarrow-Chava reduced form default probability model, a formula that bases default predictions on a sophisticated combination of financial ratios, stock price history, and macro-economic factors.
The KRIS version 7.0 models were developed using a data base of more than 4 million observations and more than 4,000 corporate failures. A complete technical guide, including full model test results and key parameters, is provided to subscribers. The KRIS service also includes a wide array of other default probability models that can be seamlessly loaded into Kamakura’s state-of-the-art enterprise risk management software engine, Kamakura Risk Manager. Available models include the non-public-firm default model, the U.S. bank model, and the sovereign model. Related data includes market-implied credit spreads and prices on all traded corporate bonds traded in the U.S. market. Macro factor parameter subscriptions include Heath, Jarrow, and Morton term structure models for government securities yields in Australia, Canada, France, Germany, Italy, Japan, Russia, Singapore, Spain, Sweden, Thailand, the United Kingdom, and the United States, plus a 13-country “World” model. All parameters are derived in a no-arbitrage manner consistent with seminal papers by Heath, Jarrow, and Morton, as well as Amin and Jarrow.
The version 7.0 model was estimated over the period from 1990, through the Great Recession and ending in February 2022. The 76 countries currently covered by the index are Argentina, Australia, Austria, Bahrain, Bangladesh, Belgium, Belize, Botswana, Brazil, Bulgaria, Canada, Chile, China, Colombia, Croatia, Cyprus, Czech Republic, Denmark, Egypt, Estonia, Finland, France, Germany, Ghana, Greece, Hungary, Hong Kong, Iceland, India, Indonesia, Ireland, Israel, Italy, Japan, Jordan, Kenya, Kuwait, Luxembourg, Malaysia, Malta, Mauritius, Mexico, Nigeria, the Netherlands, New Zealand, Norway, Oman, Pakistan, Peru, the Philippines, Poland, Portugal, Qatar, Romania, Russia, Saudi Arabia, Serbia, Singapore, Slovakia, Slovenia, South Africa, South Korea, Spain, Sri Lanka, Sweden, Switzerland, Tanzania, Taiwan, Thailand, Turkey, the United Arab Emirates, Uganda, the UK, the U.S., Vietnam and Zimbabwe.
About SAS
SAS is the leader in analytics. Through innovative software and services, SAS empowers and inspires customers around the world to transform data into intelligence. SAS gives you THE POWER TO KNOW®.
Editorial contacts:
- Martin Zorn – Martin.Zorn@sas.com
- Stas Melnikov – Stas.Melnikov@sas.com