

NEW YORK, March 4, 2024: To the readers of our monthly credit conditions report: We are changing our approach and format. Starting with this issue, we will begin the report with our market/credit commentary and follow with the movement and drivers of the Troubled Company Index®.
U.S. markets ended February in the black as AI investments and generally positive fourth quarter earnings reports continued to push up large-cap returns. All sectors were up, with consumer discretionary leading the way and utilities lagging. This momentum extended globally. Markets pushed interest rate and inflation concerns aside, and everything AI continued to provide a strong tailwind.
One can be forgiven for asking whether fundamentals still matter. Some of us once spent a lot of time analyzing interest rates, real GDP growth, cash flow and financial leverage. But that was before the AI momentum and market pressure to deploy cash–and of course, before Ben Bernanke’s promise to deploy “helicopter money” if necessary. Didn’t Covid prove that the government was always there to bail us out with monetary tools like QE, QT or whatever comes next? It seems some type of aid will always be available.
And if that’s really the case, it raises other critical questions.
Do defaults matter? How about geopolitical risks or leverage? Government debt-to-GDP levels are at or near record levels, not only in the U.S. but in China, Japan and the UK as well. On the other hand, Chuck Prince, the CEO of Citigroup, famously said back in 2007, “When the music is playing, you need to be on the dance floor.” Should we be jumping to his tune today? Is today’s AI investment yesterday’s CDO? Only time will tell, but can you afford to stay on the sideline and hold on to cash?
The debt picture further complicates matters. Is a 4.20% 10-year Treasury a good investment when you look at the U.S. deficit? Maybe that 4.40% yield on a 10-year Johnson & Johnson bond looks better when you analyze the balance sheets or fundamental financial management. Which leads to the larger question of what is happening to spreads. Even as inflation numbers have come in higher than expected, pushing out the timing of rate cuts and revising expectations for interest rate levels, spreads have continued to tighten.
Using the ICE BofA Corporate Index as a common index for high-grade debt, we can clearly see this trend. The equivalent High-Yield index makes the spread compression even more obvious.
Figure 1: ICE BofA Corporate Index Option-Adjusted Spread
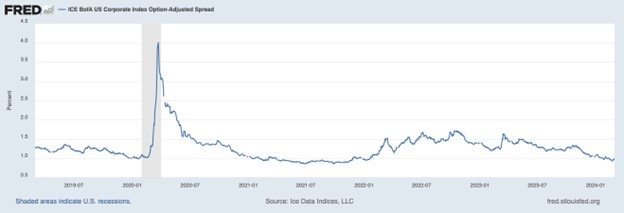
Figure 2: ICE BofA US High Yield Index Option Adjusted Spread
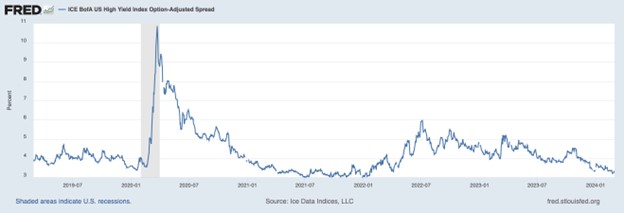
Figure 3: Troubled Company Index – US Investment Grade Corporate

With pressure to deploy cash and short-term default risk at low levels, as you can see in Figure 3, the spread compression may make sense. In the movie “Men in Black,” Tommy Lee Jones as Kay said, “There’s always an Arquillian Battle Cruiser, or a Corrillian Death Ray, or an intergalactic plague that is about to wipe out all life on this miserable little planet, and the only way these people can get on with their happy lives is that they DO NOT KNOW ABOUT IT.” By adopting this line – after all, there is always recession risk, default risk, inflation risk, geopolitical risk, or some combination thereof – perhaps good traders will be nimble enough to get out just in time. Or perhaps generative AI will do it for them. In any case, with spread compression and market pressure to deploy funds, the payoffs are asymmetrical. In this environment, investors must be very careful, as many opportunities may quickly turn into risky bets.
Contemporaneous Credit Conditions
The Kamakura Troubled Company Index® closed the month at 8.96%, down 0.07% from the prior month. The index measures the percentage of 42,500 public firms worldwide with an annualized one-month default probability of over 1%. An increase in the index reflects declining credit quality, while a decrease reflects improving credit quality.
At the end of January, the percentage of companies with a default probability between 1% and 5% was 6.57%. The percentage with a default probability between 5% and 10% was 1.21%. Those with a default probability between 10% and 20% amounted to 0.85% of the total; and those with a default probability of over 20% amounted to 0.33%. For the month short-term default probabilities ranged from a low of 8.80% on February 12 to a high of 9.17% on February 5.
Figure 4: Troubled Company Index® — February 29, 2024

There were 16 defaults in our coverage universe during the month, the same as last month. Eleven were in the U.S., three in France and one each in Belgium and the U.K.
At the end of February, the riskiest 1% of rated public firms within the coverage universe included 11 companies in the U.S. and 1 in the UK. The riskiest rated firm was JOANN Inc. (NASDAQ:JOAN), a U.S/ specialty retailer of sewing and fabrics with a one-month KDP of 34.65%, down 2.98% for the month.
Table 1: Riskiest Rated Companies Based on 1-month KDP – February 29, 2024

The Kamakura Expected Cumulative Default Rate, the only daily index of credit quality of rated firms worldwide, shows the one-year rate down 0.02% at 0.68%, with the 10-year rate down 0.13% at 9.86%.
Figure 5: Expected Cumulative Default Rate — February 29, 2024

Please provide us your feedback regarding the new format.
About the Troubled Company Index
The Kamakura Troubled Company Index® measures the percentage of 42,100 public firms in 76 countries that have an annualized one-month default risk of over one percent. The average index value since January 1990 is 14.18%. Since July 2022, the Kamakura index has used the annualized one-month default probability produced by the KRIS version 7.0 Jarrow-Chava reduced form default probability model, a formula that bases default predictions on a sophisticated combination of financial ratios, stock price history, and macro-economic factors.
The KRIS version 7.0 models were developed using a data base of more than 4 million observations and more than 4,000 corporate failures. A complete technical guide, including full model test results and key parameters, is provided to subscribers. Available models include the non-public-firm default model, the U.S. bank model, and the sovereign model.
The version 7.0 model was estimated over the period from 1990, through the Great Recession and ending in February 2022. The 76 countries currently covered by the index are Argentina, Australia, Austria, Bahrain, Bangladesh, Belgium, Belize, Botswana, Brazil, Bulgaria, Canada, Chile, China, Colombia, Croatia, Cyprus, Czech Republic, Denmark, Egypt, Estonia, Finland, France, Germany, Ghana, Greece, Hungary, Hong Kong, Iceland, India, Indonesia, Ireland, Israel, Italy, Japan, Jordan, Kenya, Kuwait, Luxembourg, Malaysia, Malta, Mauritius, Mexico, Nigeria, the Netherlands, New Zealand, Norway, Oman, Pakistan, Peru, the Philippines, Poland, Portugal, Qatar, Romania, Russia, Saudi Arabia, Serbia, Singapore, Slovakia, Slovenia, South Africa, South Korea, Spain, Sri Lanka, Sweden, Switzerland, Tanzania, Taiwan, Thailand, Turkey, the United Arab Emirates, Uganda, the UK, the U.S., Vietnam and Zimbabwe.
About SAS
SAS is the leader in analytics. Through innovative software and services, SAS empowers and inspires customers around the world to transform data into intelligence. SAS gives you THE POWER TO KNOW®.
Editorial contacts:
- Martin Zorn – Martin.Zorn@sas.com
- Stas Melnikov – Stas.Melnikov@sas.com