

Leveraged Loans: “Fear and Loathing” in Your CLO Portfolio
Authors from the North American Client Team:
Eric Penanhoat epenanhoat@kamakuraco.com
Warren A Sherman wandrewsherman@kamakuraco.com
Mark Slattery mslattery@kamakuraco.com
NEW YORK, April 17, 2020: Insurance investors in North America are the largest holders of mezzanine-level collateralized loan obligations [CLOs], according to Citi Research and Moody’s. If your investment portfolio includes CLOs, it is fairly certain that they are worth less today than when you purchased them, particularly if the underlying loans are concentrated in consumer goods, retail, hospitality, transportation, or oil and gas. Whether your valuations are obtained internally or you rely on third parties, it is incumbent on investment managers and risk practitioners to regularly stress-test them based on forward-looking economic variables, and to determine the worst-case credit value-at-risk [VaR] outcomes.
In order to illustrate this, we’ve produced VaR outputs from a simulation of selected macro factors for a sample portfolio of CLOs. Essentially, these are “before-and-after” views of March 2019 and March 2020. You’ll note that projected CLO losses increase sharply over the one-year interval between these dates, and we wish to bring this to your attention, as well as to demonstrate the power of the macro factor modeling approach.
For half of the tranches, marginal VaR (i.e., the ratio of VaR to market value) exceeds ninety percent. The VaR was generated at the 99th percentile with a one-year holding period. You’ll further observe that nothing is done in camera; all of the input data and analytical outputs produced along the way are offered up on KRIS tabs, including significance tests for the factors. There are over 1,500 loans in the 17 tranches in the sample.
Many institutions employ the same analytics (and software solutions) that were used in 2007, when they took huge write-downs or outright losses on collateralized debt obligations (CDOs). These software solutions won’t perform any better today on CLOs, for several reasons. First of all, there are too few variables to adequately characterize the range of market conditions. In addition, there is a reliance on ratings cohorts and ratings transitions, and there is no ability to stress-test correlations of the drivers of default. To paraphrase Harvard Economics Professor John Campbell, “A model which freely allows the introduction of variables will always perform as well as or better than one in which the entry of variables is constrained.” The right way to do credit analysis is to use the same approach as an actuary who is modeling life, property and casualty, or long-term care liabilities.
We believe that showing you our methods is better than telling you about them. All of the charts and tables that follow were produced in a matter of hours with an online Kamakura service called KRIS. You simply upload your CUSIPs and go to work! Each figure below demonstrates a different dimension of risk analysis, all of them critically important in the uncertain times we face today.
Figure 1: Summary of VaR Outputs, March 2020
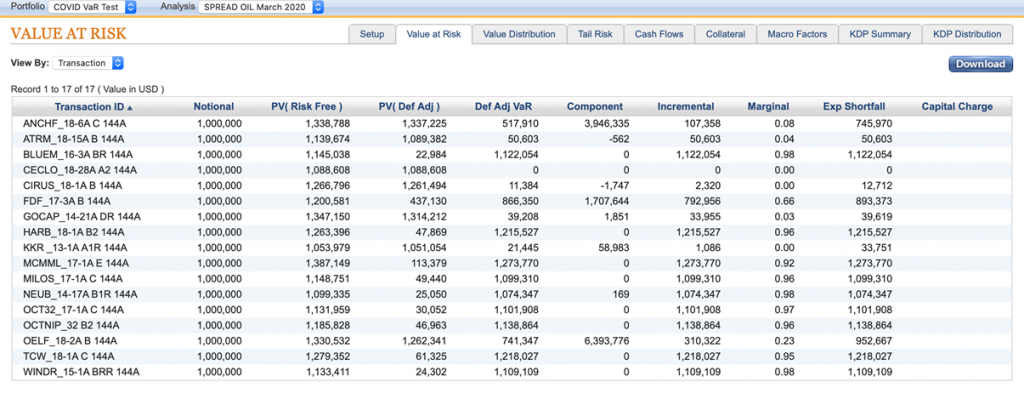
The present values (PVs) here are all well in excess of par due to their high loan interest rates relative to U.S. Treasuries. Note that the fourth tranche experienced zero defaults; that is, the expected shortfall (ES) equals zero. Sometimes VaR at the specified confidence percentile will also be zero, but it is possible at the same time that defaults occur farther out in the tail, which is why examining ES is important. VaR is calculated by Monte Carlo (MC) simulation.
Figure 2: VaR Risk Factor

This table shows the risk factors selected for the VaR study. We chose these because they’re market-related and get updated more frequently, some daily. Variables like GDP change, unemployment rate, etc. are important, but it will take a few quarters to obtain updates reflecting the current impacts to the economy. Note: it is possible to specify data transformations and lags for the factor set as desired. For macroeconomic data, such effects are often productively incorporated in the probability of default (PD) function.
Figure 3: PD Functions for Corporate Loans – Air Canada

Figure 4: PD Functions for Corporate Loans – Loral Space & Communications
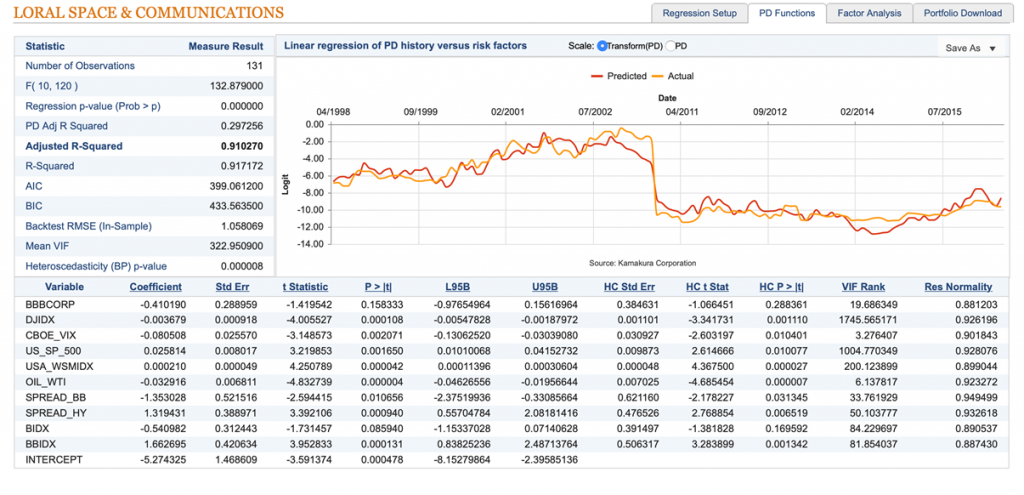
PD functions are generated by KRIS for every one of the 1,500-plus loans in these tranches. Each function independently relates the chosen risk factors to a long-term series of market, macro, and company-specific performance data for each loan obligor. You can see that each company has different factor coefficients, which determine the sensitivity of each factor for them. Further, there is a forward step-wise algorithm which tests the significance of each factor during the regression process and determines which stays in the output. There are two such PD functions shown in figures 3 and 4 above for illustrative purposes: Air Canada and Loral Space & Communications.
Figure 5: PD Distribution for a Selected Loan

Figure 5 shows the distribution of PDs for a randomly selected loan. As part of the Monte Carlo process, the chosen factors are generated randomly, in consideration of their correlations with other factors. The factor innovations directly drive the default probabilities, a process unique to reduced form modeling. The PD functions determine obligors’ sensitivities to each factor independently.
Figure 6: Tail Risk

This table shows the tail outputs, that is, the worst-loss outcomes by magnitude. The scenario number is at the left (just 1,000 MC paths for this exercise) and you can read across the top the risk factor values that produced the losses.
Figure 7a: Macro Risk Factors for CLOs, March 2019

Figure 7b: Macro Risk Factors for CLOs, March 2020

Figures 7a and 7b above show a full distribution of simulated risk factor values in 2019 and in 2020., which are also available for download. The last two panels of the charts display the distribution of simulated values for Merrill Lynch BB Corporate bond spreads and the shift from a year ago to today. Note the shift to the right on the X-axis. This is one reason simulated default probabilities increased dramatically for these CLOs.
Figure 8: Risk Factor Correlations

Finally, here is a factor correlation table, generated by the PD functions process. It can be edited by the user to create stress-test correlations and volatilities. Stress-testing factor correlations and volatilities are essential elements of a robust practice.
About Kamakura Corporation
Founded in 1990, Honolulu-based Kamakura Corporation is a leading provider of risk management information, processing, and software. Kamakura was recognized as a category leader in the Chartis Report, Technology Solutions for Credit Risk 2.0 2018. Kamakura was named to the World Finance 100 by the editor and readers of World Finance magazine in 2017, 2016 and 2012. In 2010, Kamakura was the only vendor to win two Credit Magazine innovation awards. Kamakura Risk Manager, first sold commercially in 1993 and now in version 10.0.5, is the first enterprise risk management system for users focused on credit risk, asset and liability management, market risk, stress testing, liquidity risk, counterparty credit risk, and capital allocation from a single software solution. The KRIS public firm default service was launched in 2002. The KRIS sovereign default service, the world’s first, was launched in 2008, and the KRIS nonpublic firm default service was offered beginning in 2011. Kamakura added its U.S. Bank default probability service in 2014.
Kamakura has served more than 330 clients with assets ranging in size from $1.5 billion to $3.0 trillion. Current clients have a combined “total assets” or “assets under management” in excess of $26 trillion. Its risk management products are currently used in 47 countries, including the United States, Canada, Germany, the Netherlands, France, Austria, Switzerland, the United Kingdom, Russia, Ukraine, South Africa, Australia, China, Hong Kong, India, Indonesia, Japan, Korea, Malaysia, Singapore, Sri Lanka, Taiwan, Thailand, Vietnam, and many other countries in Asia, Europe and the Middle East.
To follow risk commentary by Kamakura on a daily basis, please follow:
Kamakura CEO Dr. Donald van Deventer (www.twitter.com/dvandeventer)
Kamakura President Martin Zorn (www.twitter.com/riskmgrhi)
Kamakura’s official twitter account (www.twitter.com/KamakuraCo).
For more information, please contact:
Kamakura Corporation
2222 Kalakaua Avenue, Suite 1400, Honolulu, Hawaii 96815
Telephone: 1-808-791-9888
Facsimile: 1-808-791-9898
Information: info@kamakuraco.com
Web site: www.kamakuraco.com